Time |
Investment and Sale |
Effective Income |
Operating Expense |
Cash Flow Before Debt |
Debt Service |
Cash Flow Before Tax |
| Buy | 0 | 0 | 0 | 0 | 0 | 0 |
| Jan 02 | 0 | 0 | 0 | 0 | 0 | 0 |
| Feb 02 | 0 | 0 | (1,153,215) | (1,153,215) | 103,215 | (1,050,000) |
| Mar 02 | 0 | 0 | (48,215) | (48,215) | 48,215 | 0 |
| Apr 02 | 0 | 0 | (101,162) | (101,162) | 101,162 | 0 |
| May 02 | 0 | 0 | (151,298) | (151,298) | 151,298 | 0 |
| Jun 02 | 0 | 0 | (87,696) | (87,696) | 87,696 | 0 |
| Jul 02 | 0 | 98,700 | (107,807) | (9,107) | 107,807 | 98,700 |
| Aug 02 | 0 | 98,700 | (171,474) | (72,774) | 87,579 | 14,805 |
| Sep 02 | 0 | 98,700 | (82,083) | 16,617 | (1,812) | 14,805 |
| Oct 02 | 0 | 164,500 | (64,083) | 100,417 | (19,812) | 80,605 |
| Nov 02 | 0 | 199,280 | (64,083) | 135,197 | (75,742) | 59,455 |
| Dec 02 | 0 | 164,500 | (64,083) | 100,417 | (105,305) | (4,888) |
| Jan 03 | 0 | 219,020 | (10,083) | 208,937 | (129,742) | 79,195 |
| Feb 03 | 0 | 164,500 | (4,083) | 160,417 | (182,084) | (21,667) |
| Mar 03 | 0 | 199,280 | (4,083) | 195,197 | (135,742) | 59,455 |
| Apr 03 | 0 | 164,500 | (4,083) | 160,417 | (86,625) | 73,791 |
| May 03 | 0 | 199,280 | (4,083) | 195,197 | 0 | 195,197 |
| Jun 03 | 0 | 164,500 | (4,083) | 160,417 | 0 | 160,417 |
| Jul 03 | 0 | 199,280 | (4,083) | 195,197 | 0 | 195,197 |
| Aug 03 | 0 | 184,240 | (4,083) | 180,157 | 0 | 180,157 |
| Sep 03 | 0 | 199,280 | (4,083) | 195,197 | 0 | 195,197 |
| Oct 03 | 0 | 65,800 | 0 | 65,800 | 0 | 65,800 |
| Nov 03 | 0 | 100,580 | 0 | 100,580 | 0 | 100,580 |
| Dec 03 | 0 | 65,800 | 0 | 65,800 | 0 | 65,800 |
| Jan 04 | 0 | 100,580 | 0 | 100,580 | 0 | 100,580 |
| Feb 04 | 0 | 65,800 | 0 | 65,800 | 0 | 65,800 |
| Mar 04 | 0 | 34,780 | 0 | 34,780 | 0 | 34,780 |
| Apr 04 | 0 | 0 | 0 | 0 | 0 | 0 |
| May 04 | 0 | 0 | 0 | 0 | 0 | 0 |
| Jun 04 | 0 | 0 | 0 | 0 | 0 | 0 |
| Sell | 0 | 0 | 0 | 0 | 0 | 0 |
| Total | 0 | 2,951,600 | (2,137,949) | 813,651 | (49,891) | 763,760 |
| Rate of Return Before Debt (IRR) | 40.9% |
| Rate of Return Before Tax (IRR) | 51.2% |
Time |
Working Capital |
Interest Income |
Members' Investment |
Cash Flow Before Tax |
Distributed To Members |
Distributed To Manager |
| Buy | 0 | 0 | 1,100,000 | 0 | 0 | 0 |
| Jan 02 | 1,100,000 | 0 | 0 | 0 | 0 | 0 |
| Feb 02 | 1,100,000 | 0 | 0 | (1,050,000) | 0 | 0 |
| Mar 02 | 50,000 | 0 | 0 | 0 | 0 | 0 |
| Apr 02 | 50,000 | 0 | 0 | 0 | 0 | 0 |
| May 02 | 50,000 | 0 | 0 | 0 | 0 | 0 |
| Jun 02 | 50,000 | 0 | 0 | 0 | 0 | 0 |
| Jul 02 | 50,000 | 0 | 0 | 98,700 | 0 | 0 |
| Aug 02 | 148,700 | 0 | 0 | 14,805 | 0 | 0 |
| Sep 02 | 163,505 | 0 | 0 | 14,805 | 0 | 0 |
| Oct 02 | 178,310 | 0 | 0 | 80,605 | 0 | 0 |
| Nov 02 | 258,915 | 0 | 0 | 59,455 | 0 | 0 |
| Dec 02 | 318,370 | 0 | 0 | (4,888) | 0 | 0 |
| Jan 03 | 313,482 | 0 | 0 | 79,195 | 0 | 0 |
| Feb 03 | 392,677 | 0 | 0 | (21,667) | 0 | 0 |
| Mar 03 | 371,010 | 0 | 0 | 59,455 | 0 | 0 |
| Apr 03 | 430,465 | 0 | 0 | 73,791 | 0 | 0 |
| May 03 | 504,256 | 0 | 0 | 195,197 | 0 | 0 |
| Jun 03 | 699,453 | 0 | 0 | 160,417 | 0 | 0 |
| Jul 03 | 859,870 | 0 | 0 | 195,197 | 0 | 0 |
| Aug 03 | 1,055,066 | 0 | 0 | 180,157 | 0 | 0 |
| Sep 03 | 1,235,223 | 0 | 0 | 195,197 | 0 | 0 |
| Oct 03 | 1,430,420 | 0 | 0 | 65,800 | 0 | 0 |
| Nov 03 | 1,496,220 | 0 | 0 | 100,580 | 0 | 0 |
| Dec 03 | 1,596,800 | 0 | 0 | 65,800 | 0 | 0 |
| Jan 04 | 1,662,600 | 0 | 0 | 100,580 | 0 | 0 |
| Feb 04 | 1,763,180 | 0 | 0 | 65,800 | 0 | 0 |
| Mar 04 | 1,828,980 | 0 | 0 | 34,780 | 0 | 0 |
| Apr 04 | 1,863,760 | 0 | 0 | 0 | 0 | 0 |
| May 04 | 1,863,760 | 0 | 0 | 0 | 0 | 0 |
| Jun 04 | 1,863,760 | 0 | 0 | 0 | 0 | 0 |
| Sell | 1,863,760 | 0 | 0 | 0 | (1,741,570) | (122,190) |
| Total | 0 | 0 | 1,100,000 | 763,760 | (1,741,570) | (122,190) |
Time |
Taxable Revenue |
Interest Income |
Taxable Expense |
Interest Expense |
Depre- ciation |
Ordinary Income |
| Buy | 0 | 0 | 0 | 0 | 0 | 0 |
| Jan 02 | 0 | 0 | 0 | 0 | 0 | 0 |
| Feb 02 | 0 | 0 | 0 | 0 | 0 | 0 |
| Mar 02 | 0 | 0 | 0 | 0 | 0 | 0 |
| Apr 02 | 0 | 0 | 0 | 0 | 0 | 0 |
| May 02 | 0 | 0 | 0 | 0 | 0 | 0 |
| Jun 02 | 0 | 0 | 0 | 0 | 0 | 0 |
| Jul 02 | 98,700 | 0 | (89,081) | 0 | 0 | 9,619 |
| Aug 02 | 98,700 | 0 | (89,081) | 0 | 0 | 9,619 |
| Sep 02 | 98,700 | 0 | (89,081) | (1,812) | 0 | 7,807 |
| Oct 02 | 164,500 | 0 | (124,714) | (19,812) | 0 | 19,975 |
| Nov 02 | 199,280 | 0 | (142,530) | (12,832) | 0 | 43,918 |
| Dec 02 | 164,500 | 0 | (124,714) | (5,201) | 0 | 34,586 |
| Jan 03 | 219,020 | 0 | (160,346) | (4,366) | 0 | 54,308 |
| Feb 03 | 164,500 | 0 | (124,714) | (3,322) | 0 | 36,465 |
| Mar 03 | 199,280 | 0 | (142,530) | (1,832) | 0 | 54,918 |
| Apr 03 | 164,500 | 0 | (124,714) | (716) | 0 | 39,070 |
| May 03 | 199,280 | 0 | (142,530) | 0 | 0 | 56,750 |
| Jun 03 | 164,500 | 0 | (124,714) | 0 | 0 | 39,786 |
| Jul 03 | 199,280 | 0 | (142,530) | 0 | 0 | 56,750 |
| Aug 03 | 184,240 | 0 | (142,530) | 0 | 0 | 41,710 |
| Sep 03 | 199,280 | 0 | (142,530) | 0 | 0 | 56,750 |
| Oct 03 | 65,800 | 0 | (35,632) | 0 | 0 | 30,168 |
| Nov 03 | 100,580 | 0 | (53,449) | 0 | 0 | 47,131 |
| Dec 03 | 65,800 | 0 | (35,632) | 0 | 0 | 30,168 |
| Jan 04 | 100,580 | 0 | (53,449) | 0 | 0 | 47,131 |
| Feb 04 | 65,800 | 0 | (35,632) | 0 | 0 | 30,168 |
| Mar 04 | 34,780 | 0 | (17,816) | 0 | 0 | 16,964 |
| Apr 04 | 0 | 0 | 0 | 0 | 0 | 0 |
| May 04 | 0 | 0 | 0 | 0 | 0 | 0 |
| Jun 04 | 0 | 0 | 0 | 0 | 0 | 0 |
| Sell | 0 | 0 | 0 | 0 | 0 | 0 |
| Total | 2,951,600 | 0 | (2,137,949) | (49,891) | 0 | 763,760 |
Time |
Distributed Cash |
Ordinary Income |
Capital Gains |
Taxable Income |
Taxes |
Cash Flow After Tax |
| Buy | (10,000) | 0 | 0 | 0 | 0 | (10,000) |
| Jan 02 | 0 | 0 | 0 | 0 | 0 | 0 |
| Feb 02 | 0 | 0 | 0 | 0 | 0 | 0 |
| Mar 02 | 0 | 0 | 0 | 0 | 0 | 0 |
| Apr 02 | 0 | 0 | 0 | 0 | 0 | 0 |
| May 02 | 0 | 0 | 0 | 0 | 0 | 0 |
| Jun 02 | 0 | 0 | 0 | 0 | 0 | 0 |
| Jul 02 | 0 | 87 | 0 | 87 | (35) | (35) |
| Aug 02 | 0 | 87 | 0 | 87 | (35) | (35) |
| Sep 02 | 0 | 71 | 0 | 71 | (28) | (28) |
| Oct 02 | 0 | 182 | 0 | 182 | (72) | (72) |
| Nov 02 | 0 | 399 | 0 | 399 | (158) | (158) |
| Dec 02 | 0 | 314 | 0 | 314 | (125) | (125) |
| Jan 03 | 0 | 494 | 0 | 494 | (196) | (196) |
| Feb 03 | 0 | 331 | 0 | 331 | (131) | (131) |
| Mar 03 | 0 | 499 | 0 | 499 | (198) | (198) |
| Apr 03 | 0 | 355 | 0 | 355 | (141) | (141) |
| May 03 | 0 | 516 | 0 | 516 | (204) | (204) |
| Jun 03 | 0 | 362 | 0 | 362 | (143) | (143) |
| Jul 03 | 0 | 516 | 0 | 516 | (204) | (204) |
| Aug 03 | 0 | 379 | 0 | 379 | (150) | (150) |
| Sep 03 | 0 | 516 | 0 | 516 | (204) | (204) |
| Oct 03 | 0 | 274 | 0 | 274 | (109) | (109) |
| Nov 03 | 0 | 428 | 0 | 428 | (170) | (170) |
| Dec 03 | 0 | 274 | 0 | 274 | (109) | (109) |
| Jan 04 | 0 | 428 | 0 | 428 | (170) | (170) |
| Feb 04 | 0 | 274 | 0 | 274 | (109) | (109) |
| Mar 04 | 0 | 154 | 0 | 154 | (61) | (61) |
| Apr 04 | 0 | 0 | 0 | 0 | 0 | 0 |
| May 04 | 0 | 0 | 0 | 0 | 0 | 0 |
| Jun 04 | 0 | 0 | 0 | 0 | 0 | 0 |
| Sell | 15,832 | (1,111) | 0 | (1,111) | 440 | 16,272 |
| Total | 5,832 | 5,832 | 0 | 5,832 | (2,310) | 3,523 |
| Member's Rate of Return Before Tax (IRR) | 20.2% |
| Member's Rate of Return After Tax (IRR) | 11.7% |
Time |
Manager Fees |
Distributed Cash |
Total Cash Flow |
Taxable Income |
Taxes |
Cash Flow After Tax |
| Buy | 0 | 0 | 0 | 0 | 0 | 0 |
| Jan 02 | 0 | 0 | 0 | 0 | 0 | 0 |
| Feb 02 | 0 | 0 | 0 | 0 | 0 | 0 |
| Mar 02 | 0 | 0 | 0 | 0 | 0 | 0 |
| Apr 02 | 0 | 0 | 0 | 0 | 0 | 0 |
| May 02 | 0 | 0 | 0 | 0 | 0 | 0 |
| Jun 02 | 0 | 0 | 0 | 0 | 0 | 0 |
| Jul 02 | 0 | 0 | 0 | 0 | 0 | 0 |
| Aug 02 | 0 | 0 | 0 | 0 | 0 | 0 |
| Sep 02 | 0 | 0 | 0 | 0 | 0 | 0 |
| Oct 02 | 0 | 0 | 0 | 0 | 0 | 0 |
| Nov 02 | 0 | 0 | 0 | 0 | 0 | 0 |
| Dec 02 | 0 | 0 | 0 | 0 | 0 | 0 |
| Jan 03 | 0 | 0 | 0 | 0 | 0 | 0 |
| Feb 03 | 0 | 0 | 0 | 0 | 0 | 0 |
| Mar 03 | 0 | 0 | 0 | 0 | 0 | 0 |
| Apr 03 | 0 | 0 | 0 | 0 | 0 | 0 |
| May 03 | 0 | 0 | 0 | 0 | 0 | 0 |
| Jun 03 | 0 | 0 | 0 | 0 | 0 | 0 |
| Jul 03 | 0 | 0 | 0 | 0 | 0 | 0 |
| Aug 03 | 0 | 0 | 0 | 0 | 0 | 0 |
| Sep 03 | 0 | 0 | 0 | 0 | 0 | 0 |
| Oct 03 | 0 | 0 | 0 | 0 | 0 | 0 |
| Nov 03 | 0 | 0 | 0 | 0 | 0 | 0 |
| Dec 03 | 0 | 0 | 0 | 0 | 0 | 0 |
| Jan 04 | 0 | 0 | 0 | 0 | 0 | 0 |
| Feb 04 | 0 | 0 | 0 | 0 | 0 | 0 |
| Mar 04 | 0 | 0 | 0 | 0 | 0 | 0 |
| Apr 04 | 0 | 0 | 0 | 0 | 0 | 0 |
| May 04 | 0 | 0 | 0 | 0 | 0 | 0 |
| Jun 04 | 0 | 0 | 0 | 0 | 0 | 0 |
| Sell | 0 | 122,190 | 122,190 | 122,190 | (24,438) | 97,752 |
| Total | 0 | 122,190 | 122,190 | 122,190 | (24,438) | 97,752 |
| Managing Member's Present Value Before Tax @10% | 96,284 |
| Managing Member's Present Value After Tax @10% | 77,027 |
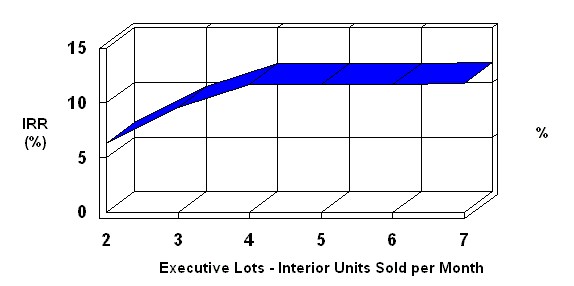
Executive Lots - Interior Units Sold per Month
versus
Member's Rate of Return After Tax
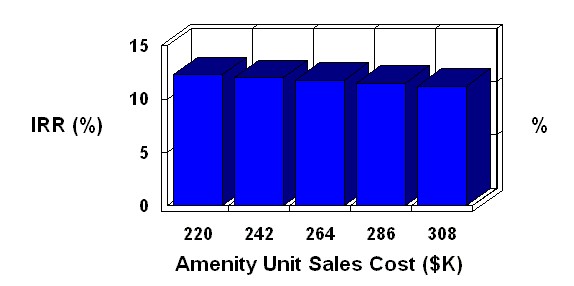
Amenity Unit Sales Cost
versus
Member's Rate of Return After Tax
| Assumption | IRR |
| $220,000.00 | 12.3% |
| $242,000.00 | 12.0% |
| $264,000.00 | 11.8% |
| $286,000.00 | 11.5% |
| $308,000.00 | 11.2% |
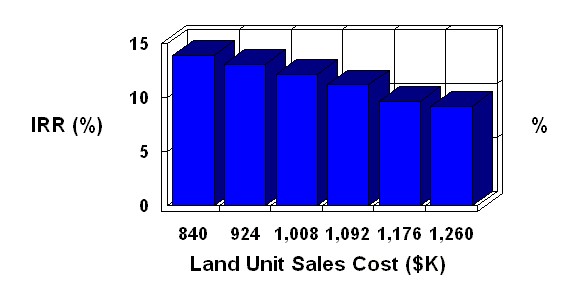
Land Unit Sales Cost
versus
Member's Rate of Return After Tax
| Assumption | IRR |
| $840,000.00 | 13.9% |
| $924,000.00 | 13.1% |
| $1,008,000.00 | 12.2% |
| $1,092,000.00 | 11.2% |
| $1,176,000.00 | 9.7% |
| $1,260,000.00 | 9.2% |
| Risk Analysis Assumption | Lowest | Likely | Highest |
| Executive Lots - Interior Units Sold per Month | 4.15 | 5.15 | 6.15 |
| Executive Lots - Golf/Lake Units Sold per Month | .5 | 1 | 2 |
| Prestige Lots - Interior Units Sold per Month | .5 | 1.5 | 2.5 |
| Prestige Lots - Interior Unit Sale Growth Rate | No Growth is projected | 1% Annually | 2% Annually |
| Executive Lots - Golf/Lake Unit Sale Growth Rate | No Growth is projected | 1% Annually | 2% Annually |
| Executive Lots - Interior Unit Sale Growth Rate | No Growth is projected | 1% Annually | 2% Annually |
| Amenity Unit Sales Cost | $200,000.00 | $270,000.00 | $300,000.00 |
| Marketing & Advertising Unit Sales Cost | $50,000.00 | $61,250.00 | $70,000.00 |
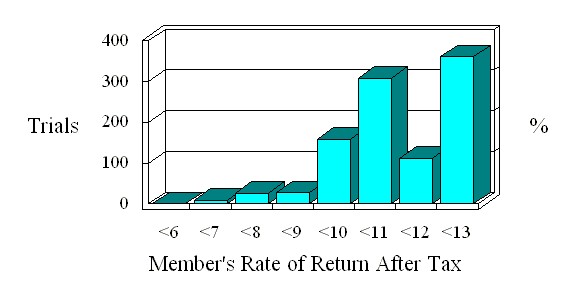
| Average IRR | 11.0% | Lowest IRR | 6.0% | Standard Deviation | 1.3% | Highest IRR | 13.0% |
| Investment Assumptions | ||
| Price of Property | None | |
| Date of Acquisition | 1 January 2002 | |
| Holding Period | 2.5 Years | |
| Inflation Rate | 4% per Year | |
| Sale Price Method | No Sale Price Specified | |
| Selling Costs | 6% | |
| Group Member's Assumptions | ||
| General Vacancy & Credit Loss | Zero | |
| Tax Rate - First Year | 39.6% | |
| Tax Rate - Following Years | 39.6% | |
| Capital Gain Rate | 20% | |
| Cost Recovery Recapture Rate | 25% - Losses Taken Currently | |
| Present Value Discount Rate Before Debt | 10% per Year | |
| Present Value Discount Rate Before Tax | 10% per Year | |
| Present Value Discount Rate After Tax | 10% per Year | |
| Group Assumptions | ||
| Total Initial Investment | $1,100,000.00 | |
| Working Capital Minimum | $50,000.00 | |
| Working Capital Maximum | $5,000.00 | |
| Working Capital Interest Rate | Zero | |
| Managing Member Loan Interest Rate | 0% per Year | |
| Managing Member Tax Rate | 35% per Year | |
| Number of Units Issued | 110 | |
| Cash Distribution Pattern | Yearly in January | |
| Distribution Assumptions | ||
| Cash Distribution Start Date | 1 April 2004 | |
| Preferred Return to Members | 10% Cumulative | |
| Cash to Members | 75% | |
| Net Taxable Income to Members | 75% | |
| Investment Return to Members | 100% of Investment | |
| Sale Proceeds to Members | 75% | |
| Capital Gain to Members | 75% | |
| Unit Sales Draw Assumptions | ||
| Draw Percent | 100% | |
| Draw Rate | 10% Annually | |
| Draw Period | 1 Month | |
| Draw Interest Payment | Accrued | |
| Draw Limit | None | |
| Draw Points | None | |
| Draw Discharge Rate | 85% | |
| Unit Sales Parameter Assumptions | ||
| Price Multiplier | 100% | |
| Cost Multiplier | 100% | |
| Sale Cost/Unit | Zero | |
| Inflate Unit Prices | No | |
| Price Growth Rate | 10% Over Inflation | |
| Inflate Costs | No | |
| Cost Growth Rate | 10% Over Inflation | |
| Parameter Application Offset | None | |
| Absorption Schedule Stretcher | None | |
| Executive Lots - Interior Unit Sales Absorption Assumptions | ||
| 0 |
||
| Unit Price | $21,000.00 | |
| Total Units to be Sold | 77 | |
| Unit Sale Start Date | 1 July 2002 | |
| Unit Sale Growth Rate | No Growth is projected | |
| Units Sold per Month | 5.15 | |
| Unit Standard Cost | $21,000.00 | |
| Unit Sale Cost | 6% of Unit Sales | |
| Executive Lots - Golf/Lake Unit Sales Absorption Assumptions | ||
| 0 |
||
| Unit Price | $33,000.00 | |
| Total Units to be Sold | 17 | |
| Unit Sale Start Date | 1 October 2002 | |
| Unit Sale Growth Rate | No Growth is projected | |
| Units Sold per Month | 1 | |
| Unit Standard Cost | $33,000.00 | |
| Unit Sale Cost | 6% of Unit Sales | |
| Prestige Lots - Interior Unit Sales Absorption Assumptions | ||
| 0 |
||
| Unit Price | $37,000.00 | |
| Total Units to be Sold | 26 | |
| Unit Sale Start Date | 1 October 2002 | |
| Unit Sale Growth Rate | No Growth is projected | |
| Units Sold per Month | 1.5 | |
| Unit Standard Cost | $37,000.00 | |
| Unit Sale Cost | 6% of Unit Sales | |
| Land Unit Sales Spending Assumptions | ||
| Unit Sales Cost | $1,050,000.00 | |
| Expenditure Start | 1 February 2002 | |
| Expenditure Months | 1 Month | |
| Include in Draws | Zero | |
| Clearing & Grading Unit Sales Spending Assumptions | ||
| Unit Sales Cost | $59,429.00 | |
| Expenditure Start | 1 February 2002 | |
| Expenditure Months | 2 Months | |
| Include in Draws | 100% | |
| Paving Unit Sales Spending Assumptions | ||
| Unit Sales Cost | $114,549.00 | |
| Expenditure Start | 1 July 2002 | |
| Expenditure Months | 2 Months | |
| Include in Draws | 100% | |
| Curb & Gutter Unit Sales Spending Assumptions | ||
| Unit Sales Cost | $64,232.00 | |
| Expenditure Start | 1 July 2002 | |
| Expenditure Months | 2 Months | |
| Include in Draws | 100% | |
| Sanitary Sewer Unit Sales Spending Assumptions | ||
| Unit Sales Cost | $158,810.00 | |
| Expenditure Start | 1 April 2002 | |
| Expenditure Months | 3 Months | |
| Include in Draws | 100% | |
| Storm Sewer Unit Sales Spending Assumptions | ||
| Unit Sales Cost | $61,277.00 | |
| Expenditure Start | 1 April 2002 | |
| Expenditure Months | 3 Months | |
| Include in Draws | 100% | |
| Water Unit Sales Spending Assumptions | ||
| Unit Sales Cost | $63,602.00 | |
| Expenditure Start | 1 May 2002 | |
| Expenditure Months | 1 Month | |
| Include in Draws | 100% | |
| Entrance Unit Sales Spending Assumptions | ||
| Unit Sales Cost | $36,000.00 | |
| Expenditure Start | 1 August 2002 | |
| Expenditure Months | 2 Months | |
| Include in Draws | 100% | |
| Power & Street Lighting Unit Sales Spending Assumptions | ||
| Unit Sales Cost | $9,300.00 | |
| Expenditure Start | 1 April 2002 | |
| Expenditure Months | 1 Month | |
| Include in Draws | 100% | |
| Amenity Unit Sales Spending Assumptions | ||
| Unit Sales Cost | $270,000.00 | |
| Expenditure Start | 1 August 2002 | |
| Expenditure Months | 5 Months | |
| Include in Draws | 100% | |
| Contingency Unit Sales Spending Assumptions | ||
| Unit Sales Cost | $35,000.00 | |
| Expenditure Start | 1 February 2002 | |
| Expenditure Months | 1 Month | |
| Include in Draws | 100% | |
| Design Unit Sales Spending Assumptions | ||
| Unit Sales Cost | $37,500.00 | |
| Expenditure Start | 1 February 2002 | |
| Expenditure Months | 3 Months | |
| Include in Draws | 100% | |
| Layout Unit Sales Spending Assumptions | ||
| Unit Sales Cost | $25,000.00 | |
| Expenditure Start | 1 May 2002 | |
| Expenditure Months | 3 Months | |
| Include in Draws | 100% | |
| Taxes & Insurance Unit Sales Spending Assumptions | ||
| Unit Sales Cost | $12,000.00 | |
| Expenditure Start | 1 February 2002 | |
| Expenditure Months | 12 Months | |
| Include in Draws | 100% | |
| Legal & Closing Unit Sales Spending Assumptions | ||
| Unit Sales Cost | $13,000.00 | |
| Expenditure Start | 1 February 2002 | |
| Expenditure Months | 1 Month | |
| Include in Draws | 100% | |
| Appraisal Unit Sales Spending Assumptions | ||
| Unit Sales Cost | $5,000.00 | |
| Expenditure Start | 1 February 2002 | |
| Expenditure Months | 1 Month | |
| Include in Draws | 100% | |
| Marketing & Advertising Unit Sales Spending Assumptions | ||
| Unit Sales Cost | $61,250.00 | |
| Expenditure Start | 1 July 2002 | |
| Expenditure Months | 15 Months | |
| Include in Draws | 100% | |
| County Fees Unit Sales Spending Assumptions | ||
| Unit Sales Cost | $2,000.00 | |
| Expenditure Start | 1 February 2002 | |
| Expenditure Months | 1 Month | |
| Include in Draws | 100% | |
| Development Fees Unit Sales Spending Assumptions | ||
| Unit Sales Cost | $60,000.00 | |
| Expenditure Start | 1 February 2002 | |
| Expenditure Months | 12 Months | |
| Include in Draws | 100% | |