Annual Property Operating Data
Retail - Office
The APOD is a very useful snapshot of the status of a property investment as of the projected Acquisition Date, showing most of the information relevant to the investment, absent any projections of performance.
|
Purpose |
For Sale |
|
Name |
Retail - Office |
|
Location |
USA |
|
Property Type |
Retail - Office |
|
Date |
18 April 2008 |
|
Square Feet |
20,000 |
|
Price |
$4,000,000 |
|
-Loans |
2,267,138 |
|
Down Payment |
1,732,862 |
|
+Acq Costs |
20,000 |
|
+Loan Points |
22,671 |
|
Investment |
1,775,534 |
|
|
$/SqFt |
% of GI |
Annual $ |
|
Gross Income |
|
|
|
|
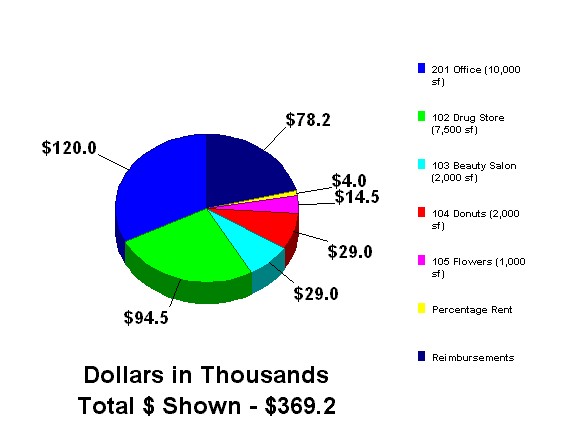
201 Office (10,000 sf) |
12.00 |
32.5% |
120,000 |
|
102 Drug Store (7,500 sf) |
12.60 |
25.6% |
94,500 |
|
103 Beauty Salon (2,000 sf) |
14.50 |
7.9% |
29,000 |
|
104 Donuts (2,000 sf) |
14.50 |
7.9% |
29,000 |
|
105 Flowers (1,000 sf) |
14.50 |
3.9% |
14,500 |
|
Base Rental Revenue |
$14.35 |
77.7% |
$287,000 |
|
Percentage Rent |
$0.20 |
1.1% |
$4,000 |
|
Total Reimbursements |
$3.91 |
21.2% |
$78,233 |
|
Total Gross Income |
$18.46 |
100.0% |
$369,233 |
|
- Vacancy & Credit Loss |
0.00 |
0.0% |
0 |
|
Effective Income |
$18.46 |
100.0% |
$369,233 |
|
Less: Operating Expenses |
|
|
|
|
Maintenance |
0.57 |
3.1% |
11,400 |
|
Insurance |
0.23 |
1.2% |
4,600 |
|
Property Taxes |
2.00 |
10.8% |
40,000 |
|
Security |
0.15 |
0.8% |
3,000 |
|
Utilities |
0.17 |
0.9% |
3,400 |
|
Management Fee |
0.70 |
3.8% |
14,000 |
|
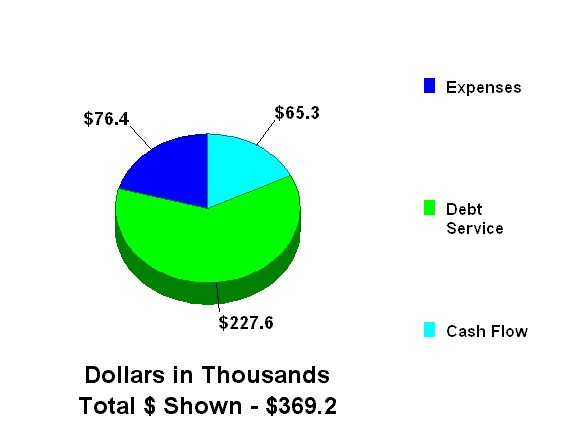
Total Operating Expenses |
$3.82 |
20.7% |
$76,400 |
|
Net Operating Income |
$14.64 |
79.3% |
$292,833 |
|
Less: Debt Service |
|
|
|
|
Loan |
11.38 |
61.6% |
227,559 |
|
Total Debt Service |
$11.38 |
61.6% |
$227,559 |
|
Net Operating Cash Flow |
$3.26 |
17.7% |
$65,274 |
|
Capitalization Rate |
7.32% |
|
Gross Income Multiplier |
10.83 |
|
Cash on Cash |
3.68% |
|
Debt Coverage Ratio |
1.287 |
|
Price/SqFt |
$200 |
|
|
|
|
Use of Effective Income at Acquisition (
Retail - Office
|
|
|
|
Source of Gross Income at Acquisition ($
Retail - Office
|
|
|
|
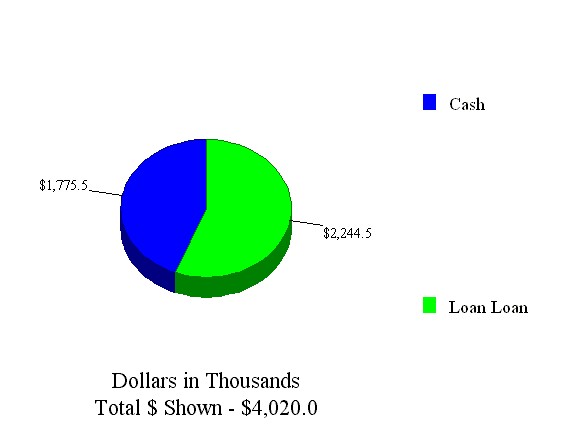
Property Acquisition Report
Retail - Office
This report shows the projected cash requirement for acquisition of the Retail - Office on 1 January 2008.
|
Cost of Property Acquired |
|
|
|
|
Price of Property |
$4,000,000 |
|
|
|
+ Closing Costs (.5%) |
20,000 |
|
|
|
Total Cost of Property Acquired |
|
|
$4,020,000 |
|
|
|
|
|
|
Property Financing |
|
|
|
|
Loan Loan Principal |
$2,267,138 |
|
|
|
- Points (1 Point) |
22,671 |
|
|
|
Loan Loan Proceeds |
|
$2,244,466 |
|
|
Total Net Loan Proceeds |
|
|
2,244,466 |
|
Cash Required at Acquisition |
|
|
$1,775,534 |
|
|
|
|
Source of Acquisition Funds
Retail - Office
|
|
|
|
Retail - Office
Acquisition Annual Gross Income Tenant Rent Roll
|
Tenant Name |
Suite |
RSF |
Start |
End |
Rent/RSF |
Reimb/RSF |
Total/RSF |
Total $ |
|
Office |
201 |
10,000 |
1/08 |
1/10 |
12.00 |
3.58 |
15.58 |
155,789 |
|
Tenant Name |
Suite |
RSF |
Start |
End |
Rent/RSF |
Reimb/RSF |
Total/RSF |
Total $ |
|
Drug Store |
102 |
7,500 |
1/07 |
1/13 |
13.13 |
3.40 |
16.53 |
123,967 |
|
Tenant Name |
Suite |
RSF |
Start |
End |
Rent/RSF |
Reimb/RSF |
Total/RSF |
Total $ |
|
Beauty Salon |
103 |
2,000 |
1/08 |
4/08 |
14.50 |
3.40 |
17.90 |
35,791 |
|
Tenant Name |
Suite |
RSF |
Start |
End |
Rent/RSF |
Reimb/RSF |
Total/RSF |
Total $ |
|
Donuts |
104 |
2,000 |
1/08 |
11/08 |
14.50 |
3.40 |
17.90 |
35,791 |
|
Tenant Name |
Suite |
RSF |
Start |
End |
Rent/RSF |
Reimb/RSF |
Total/RSF |
Total $ |
|
Flowers |
105 |
1,000 |
1/08 |
7/13 |
14.50 |
3.40 |
17.90 |
17,896 |
|
Tenant Name |
Suite |
RSF |
Start |
End |
Rent/RSF |
Reimb/RSF |
Total/RSF |
Total $ |
|
Totals |
|
22,500 |
|
|
12.93 |
3.48 |
16.41 |
369,233 |
|
|
|
|
Rentable Square Feet Distribution
Retail - Office
|
|
|
|
Proforma Income Statement
Retail - Office
This Statement is for the Retail - Office as acquired on 1 January 2008 for a Price of $4,000,000, subject to a Loan of $2,267,138, for a Down Payment of $1,732,862.
|
|
2008 |
2009 |
2010 |
2011 |
2012 |
2013 |
2014 |
2015 |
2016 |
2017 |
|
Gross Income |
|
|
|
|
|
|
|
|
|
|
|
201 Office |
120,000 |
123,600 |
141,419 |
145,338 |
149,698 |
154,189 |
158,814 |
163,916 |
168,491 |
173,545 |
|
102 Drug Store |
94,500 |
94,500 |
99,225 |
99,225 |
99,225 |
119,902 |
122,701 |
126,382 |
130,173 |
134,078 |
|
103 Beauty Salon |
31,548 |
32,963 |
33,952 |
34,537 |
34,218 |
35,244 |
36,309 |
37,389 |
38,511 |
39,666 |
|
104 Donuts |
29,366 |
31,313 |
32,252 |
33,220 |
34,215 |
35,242 |
36,299 |
37,473 |
38,511 |
39,666 |
|
105 Flowers |
14,500 |
14,500 |
15,500 |
16,500 |
16,500 |
17,210 |
18,152 |
18,696 |
19,273 |
19,834 |
|
Base Rental Revenue |
$289,914 |
$296,876 |
$322,348 |
$328,820 |
$333,856 |
$361,786 |
$372,275 |
$383,856 |
$394,959 |
$406,791 |
|
Percentage Rent |
$4,000 |
$4,280 |
$4,566 |
$4,857 |
$5,154 |
$5,457 |
$5,766 |
$6,082 |
$6,403 |
$6,731 |
|
Total Reimbursements |
$78,233 |
$80,217 |
$47,812 |
$46,778 |
$48,936 |
$51,155 |
$53,438 |
$51,673 |
$53,266 |
$55,752 |
|
Total Gross Income |
$372,147 |
$381,373 |
$374,725 |
$380,455 |
$387,945 |
$418,398 |
$431,479 |
$441,610 |
$454,628 |
$469,274 |
|
Less: Vacancy & Credit Loss |
22,677 |
0 |
14,890 |
6,897 |
0 |
52,992 |
3,761 |
17,870 |
1,980 |
4,111 |
|
Effective Income |
$349,471 |
$381,373 |
$359,835 |
$373,558 |
$387,945 |
$365,407 |
$427,718 |
$423,740 |
$452,648 |
$465,163 |
|
Less: Operating Expenses |
|
|
|
|
|
|
|
|
|
|
|
Maintenance |
11,400 |
11,742 |
12,094 |
12,457 |
12,831 |
13,216 |
13,612 |
14,021 |
14,441 |
14,874 |
|
Insurance |
4,600 |
4,830 |
5,072 |
5,325 |
5,591 |
5,871 |
6,164 |
6,473 |
6,796 |
7,136 |
|
Property Taxes |
40,000 |
40,800 |
41,616 |
42,448 |
43,297 |
44,163 |
45,046 |
45,947 |
46,866 |
47,804 |
|
Security |
3,000 |
3,090 |
3,183 |
3,278 |
3,377 |
3,478 |
3,582 |
3,690 |
3,800 |
3,914 |
|
Utilities |
3,400 |
3,502 |
3,607 |
3,715 |
3,827 |
3,942 |
4,060 |
4,182 |
4,307 |
4,436 |
|
Management Fee |
14,000 |
14,420 |
14,853 |
15,298 |
15,757 |
16,230 |
16,717 |
17,218 |
17,735 |
18,267 |
|
Total Operating Expenses |
$76,400 |
$78,384 |
$80,424 |
$82,522 |
$84,680 |
$86,899 |
$89,182 |
$91,530 |
$93,946 |
$96,432 |
|
Net Operating Income |
$273,071 |
$302,989 |
$279,411 |
$291,035 |
$303,266 |
$278,508 |
$338,536 |
$332,210 |
$358,702 |
$368,732 |
|
Less: Debt Service |
|
|
|
|
|
|
|
|
|
|
|
Loan |
227,559 |
227,559 |
227,559 |
227,559 |
227,559 |
227,559 |
227,559 |
227,559 |
227,559 |
227,559 |
|
Total Debt Service |
$227,559 |
$227,559 |
$227,559 |
$227,559 |
$227,559 |
$227,559 |
$227,559 |
$227,559 |
$227,559 |
$227,559 |
|
Net Operating Cash Flow |
$45,512 |
$75,430 |
$51,852 |
$63,476 |
$75,707 |
$50,949 |
$110,977 |
$104,651 |
$131,143 |
$141,173 |
|
Less: Capital Spending |
|
|
|
|
|
|
|
|
|
|
|
Market TI's |
12,279 |
0 |
101,034 |
2,240 |
2,251 |
62,644 |
2,454 |
119,881 |
1,292 |
0 |
|
Market Commissions |
6,022 |
0 |
11,264 |
1,052 |
1,058 |
22,907 |
1,153 |
14,249 |
607 |
0 |
|
Total Capital Spending |
$18,301 |
$0 |
$112,299 |
$3,292 |
$3,309 |
$85,551 |
$3,606 |
$134,130 |
$1,899 |
$0 |
|
Cash Flow Before Tax |
$27,211 |
$75,430 |
($60,447) |
$60,184 |
$72,398 |
($34,603) |
$107,370 |
($29,479) |
$129,244 |
$141,173 |
|
Taxable Income and Taxes |
|
|
|
|
|
|
|
|
|
|
|
(Losses Taken Currently) |
|
|
|
|
|
|
|
|
|
|
|
Taxable Revenues |
$349,471 |
$381,373 |
$359,835 |
$373,558 |
$387,945 |
$365,407 |
$427,718 |
$423,740 |
$452,648 |
$465,163 |
|
Less: Deducted Expenses |
76,400 |
78,384 |
80,424 |
82,522 |
84,680 |
86,899 |
89,182 |
91,530 |
93,946 |
96,432 |
|
Less: Interest Expense |
179,639 |
175,662 |
171,354 |
166,690 |
161,637 |
156,166 |
150,240 |
143,823 |
136,873 |
129,346 |
|
Less: Amortized Points |
1,134 |
1,134 |
1,134 |
1,134 |
1,134 |
1,134 |
1,134 |
1,134 |
1,134 |
1,134 |
|
Less: Depreciation |
69,157 |
74,621 |
79,115 |
83,442 |
82,353 |
86,999 |
91,423 |
95,829 |
100,028 |
83,538 |
|
Ordinary Income |
$23,141 |
$51,573 |
$27,808 |
$39,771 |
$58,141 |
$34,210 |
$95,739 |
$91,425 |
$120,667 |
$154,714 |
|
Taxable Income |
23,141 |
51,573 |
27,808 |
39,771 |
58,141 |
34,210 |
95,739 |
91,425 |
120,667 |
154,714 |
|
Taxes Due (- = Savings) |
9,604 |
21,403 |
11,540 |
16,505 |
24,129 |
14,197 |
39,731 |
37,941 |
50,077 |
64,206 |
|
Cash Flow After Tax |
$17,607 |
$54,027 |
($71,987) |
$43,679 |
$48,269 |
($48,800) |
$67,639 |
($67,420) |
$79,167 |
$76,967 |
|
Sale Proceeds: |
|
|
|
|
|
|
|
|
|
|
|
Sale Value |
$3,653,530 |
$3,759,804 |
$3,637,943 |
$3,790,821 |
$3,481,345 |
$4,231,700 |
$4,152,626 |
$4,483,773 |
$4,609,147 |
$4,024,231 |
|
Less: Sale Costs (7%) |
255,747 |
263,186 |
254,656 |
265,357 |
243,694 |
296,219 |
290,684 |
313,864 |
322,640 |
281,696 |
|
Less: Loan Repayment |
2,132,531 |
2,082,661 |
2,111,116 |
2,050,247 |
1,984,325 |
1,912,932 |
1,835,614 |
1,751,878 |
1,661,192 |
1,562,979 |
|
Sale Proceeds Before Tax |
1,265,252 |
1,413,957 |
1,272,171 |
1,475,217 |
1,253,326 |
2,022,549 |
2,026,329 |
2,418,031 |
2,625,315 |
2,179,556 |
|
Less: Taxes due to Sale |
(104,296) |
(68,325) |
(90,162) |
(56,926) |
(87,833) |
33,548 |
36,598 |
104,685 |
157,497 |
46,959 |
|
Sale Proceeds After Tax |
1,369,548 |
1,482,281 |
1,362,333 |
1,532,143 |
1,341,159 |
1,989,001 |
1,989,731 |
2,313,347 |
2,467,818 |
2,132,597 |
|
Ratio Analysis: |
|
|
|
|
|
|
|
|
|
|
|
Profitability Ratios |
|
|
|
|
|
|
|
|
|
|
|
Capitalization Rate |
6.83% |
7.57% |
6.99% |
7.28% |
7.58% |
6.96% |
8.46% |
8.31% |
8.97% |
9.22% |
|
Adj. Capitalization Rate |
6.83% |
7.55% |
6.95% |
7.05% |
7.34% |
6.73% |
8.02% |
7.87% |
8.23% |
8.45% |
|
Cash on Cash Before Tax |
2.56% |
4.25% |
2.92% |
3.58% |
4.26% |
2.87% |
6.25% |
5.89% |
7.39% |
7.95% |
|
Adj. Cash on Cash Before Tax |
2.56% |
4.21% |
2.89% |
3.33% |
3.96% |
2.66% |
5.55% |
5.24% |
6.14% |
6.60% |
|
Cash on Cash After Tax |
2.02% |
3.04% |
2.27% |
2.65% |
2.90% |
2.07% |
4.01% |
3.76% |
4.57% |
4.33% |
|
Adj. Cash on Cash After Tax |
2.02% |
3.02% |
2.25% |
2.46% |
2.70% |
1.92% |
3.57% |
3.34% |
3.80% |
3.60% |
|
Risk Ratios |
|
|
|
|
|
|
|
|
|
|
|
Debt Coverage Ratio |
1.200 |
1.331 |
1.228 |
1.279 |
1.333 |
1.224 |
1.488 |
1.460 |
1.576 |
1.620 |
|
Breakeven Occupancy |
81.7% |
80.2% |
82.2% |
81.5% |
80.5% |
75.2% |
73.4% |
72.3% |
70.7% |
69.0% |
|
Loan Balance/Property Value |
58.4% |
55.4% |
58.0% |
54.1% |
57.0% |
45.2% |
44.2% |
39.1% |
36.0% |
38.8% |
|
Assumption Ratios |
|
|
|
|
|
|
|
|
|
|
|
NOI/Property Value |
7.47% |
8.06% |
7.68% |
7.68% |
8.71% |
6.58% |
8.15% |
7.41% |
7.78% |
9.16% |
|
Operating Expense Ratio |
20.5% |
20.6% |
21.5% |
21.7% |
21.8% |
20.8% |
20.7% |
20.7% |
20.7% |
20.5% |
|
Analysis Measures: |
|
|
|
|
|
|
|
|
|
|
|
IRR Before Debt |
|
0.2% |
0.8% |
3.5% |
2.9% |
6.2% |
6.2% |
6.9% |
7.4% |
6.5% |
|
IRR Before Tax |
|
|
|
|
|
3.5% |
3.8% |
5.3% |
6.3% |
4.5% |
|
IRR After Tax |
|
|
|
|
|
2.3% |
2.4% |
3.7% |
4.4% |
2.9% |
|
NPV Before Debt @10.00% |
($697,680) |
($643,376) |
($843,666) |
($771,189) |
($973,498) |
($649,628) |
($708,871) |
($650,600) |
($619,244) |
($845,040) |
|
NPV Before Tax @10.00% |
($688,123) |
($605,974) |
($779,063) |
($683,892) |
($866,213) |
($524,805) |
($568,727) |
($497,142) |
($454,284) |
($670,219) |
|
NPV After Tax @10.00% |
($627,490) |
($575,640) |
($749,049) |
($695,679) |
($877,958) |
($617,895) |
($683,769) |
($660,244) |
($658,391) |
($848,585) |
|
|
|
|
Common Size Income Statement
Retail - Office
This Statement is for the Retail - Office as acquired on 1 January 2008 for a Price of $4,000,000, subject to a Loan of $2,267,138, for a Down Payment of $1,732,862.
|
|
2008 |
2009 |
2010 |
2011 |
2012 |
2013 |
2014 |
2015 |
2016 |
2017 |
|
Gross Income |
|
|
|
|
|
|
|
|
|
|
|
201 Office |
32.2% |
32.4% |
37.7% |
38.2% |
38.6% |
36.9% |
36.8% |
37.1% |
37.1% |
37.0% |
|
102 Drug Store |
25.4% |
24.8% |
26.5% |
26.1% |
25.6% |
28.7% |
28.4% |
28.6% |
28.6% |
28.6% |
|
103 Beauty Salon |
8.5% |
8.6% |
9.1% |
9.1% |
8.8% |
8.4% |
8.4% |
8.5% |
8.5% |
8.5% |
|
104 Donuts |
7.9% |
8.2% |
8.6% |
8.7% |
8.8% |
8.4% |
8.4% |
8.5% |
8.5% |
8.5% |
|
105 Flowers |
3.9% |
3.8% |
4.1% |
4.3% |
4.3% |
4.1% |
4.2% |
4.2% |
4.2% |
4.2% |
|
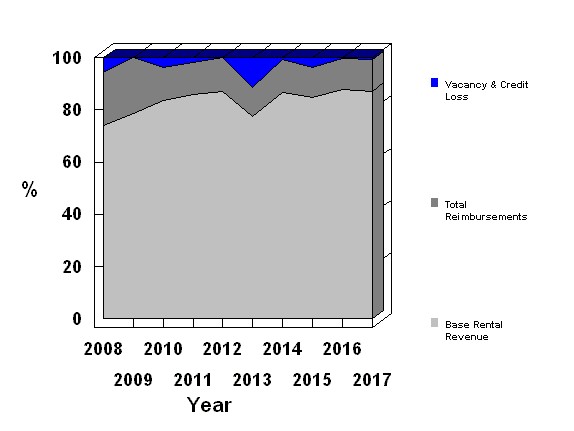
Base Rental Revenue |
77.9% |
77.8% |
86.0% |
86.4% |
86.1% |
86.5% |
86.3% |
86.9% |
86.9% |
86.7% |
|
Percentage Rent |
1.1% |
1.1% |
1.2% |
1.3% |
1.3% |
1.3% |
1.3% |
1.4% |
1.4% |
1.4% |
|
Total Reimbursements |
21.0% |
21.0% |
12.8% |
12.3% |
12.6% |
12.2% |
12.4% |
11.7% |
11.7% |
11.9% |
|
Total Gross Income |
100.0% |
100.0% |
100.0% |
100.0% |
100.0% |
100.0% |
100.0% |
100.0% |
100.0% |
100.0% |
|
Less: Vacancy & Credit Loss |
6.1% |
0.0% |
4.0% |
1.8% |
0.0% |
12.7% |
0.9% |
4.0% |
0.4% |
0.9% |
|
Effective Income |
93.9% |
100.0% |
96.0% |
98.2% |
100.0% |
87.3% |
99.1% |
96.0% |
99.6% |
99.1% |
|
Less: Operating Expenses |
|
|
|
|
|
|
|
|
|
|
|
Maintenance |
3.1% |
3.1% |
3.2% |
3.3% |
3.3% |
3.2% |
3.2% |
3.2% |
3.2% |
3.2% |
|
Insurance |
1.2% |
1.3% |
1.4% |
1.4% |
1.4% |
1.4% |
1.4% |
1.5% |
1.5% |
1.5% |
|
Property Taxes |
10.7% |
10.7% |
11.1% |
11.2% |
11.2% |
10.6% |
10.4% |
10.4% |
10.3% |
10.2% |
|
Security |
0.8% |
0.8% |
0.8% |
0.9% |
0.9% |
0.8% |
0.8% |
0.8% |
0.8% |
0.8% |
|
Utilities |
0.9% |
0.9% |
1.0% |
1.0% |
1.0% |
0.9% |
0.9% |
0.9% |
0.9% |
0.9% |
|
Management Fee |
3.8% |
3.8% |
4.0% |
4.0% |
4.1% |
3.9% |
3.9% |
3.9% |
3.9% |
3.9% |
|
Total Operating Expenses |
20.5% |
20.6% |
21.5% |
21.7% |
21.8% |
20.8% |
20.7% |
20.7% |
20.7% |
20.5% |
|
Net Operating Income |
73.4% |
79.4% |
74.6% |
76.5% |
78.2% |
66.6% |
78.5% |
75.2% |
78.9% |
78.6% |
|
Less: Debt Service |
|
|
|
|
|
|
|
|
|
|
|
Loan |
61.1% |
59.7% |
60.7% |
59.8% |
58.7% |
54.4% |
52.7% |
51.5% |
50.1% |
48.5% |
|
Total Debt Service |
61.1% |
59.7% |
60.7% |
59.8% |
58.7% |
54.4% |
52.7% |
51.5% |
50.1% |
48.5% |
|
Net Operating Cash Flow |
12.2% |
19.8% |
13.8% |
16.7% |
19.5% |
12.2% |
25.7% |
23.7% |
28.8% |
30.1% |
|
Less: Capital Spending |
|
|
|
|
|
|
|
|
|
|
|
Market TI's |
3.3% |
0.0% |
27.0% |
0.6% |
0.6% |
15.0% |
0.6% |
27.1% |
0.3% |
0.0% |
|
Market Commissions |
1.6% |
0.0% |
3.0% |
0.3% |
0.3% |
5.5% |
0.3% |
3.2% |
0.1% |
0.0% |
|
Total Capital Spending |
4.9% |
0.0% |
30.0% |
0.9% |
0.9% |
20.4% |
0.8% |
30.4% |
0.4% |
0.0% |
|
Cash Flow Before Tax |
7.3% |
19.8% |
(16.1%) |
15.8% |
18.7% |
(8.3%) |
24.9% |
(6.7%) |
28.4% |
30.1% |
|
|
|
|
Square Footage Income Statement
Retail - Office
This Statement is for the Retail - Office as acquired on 1 January 2008 for a Price of $4,000,000, subject to a Loan of $2,267,138, for a Down Payment of $1,732,862.
|
|
2008 |
2009 |
2010 |
2011 |
2012 |
2013 |
2014 |
2015 |
2016 |
2017 |
|
Gross Income |
|
|
|
|
|
|
|
|
|
|
|
201 Office (10,000 sf) |
12.00 |
12.36 |
14.14 |
14.53 |
14.97 |
15.42 |
15.88 |
16.39 |
16.85 |
17.35 |
|
102 Drug Store (7,500 sf) |
12.60 |
12.60 |
13.23 |
13.23 |
13.23 |
15.99 |
16.36 |
16.85 |
17.36 |
17.88 |
|
103 Beauty Salon (2,000 sf) |
15.77 |
16.48 |
16.98 |
17.27 |
17.11 |
17.62 |
18.15 |
18.69 |
19.26 |
19.83 |
|
104 Donuts (2,000 sf) |
14.68 |
15.66 |
16.13 |
16.61 |
17.11 |
17.62 |
18.15 |
18.74 |
19.26 |
19.83 |
|
105 Flowers (1,000 sf) |
14.50 |
14.50 |
15.50 |
16.50 |
16.50 |
17.21 |
18.15 |
18.70 |
19.27 |
19.83 |
|
Base Rental Revenue |
$14.50 |
$14.84 |
$16.12 |
$16.44 |
$16.69 |
$18.09 |
$18.61 |
$19.19 |
$19.75 |
$20.34 |
|
Percentage Rent |
$0.20 |
$0.21 |
$0.23 |
$0.24 |
$0.26 |
$0.27 |
$0.29 |
$0.30 |
$0.32 |
$0.34 |
|
Total Reimbursements |
$3.91 |
$4.01 |
$2.39 |
$2.34 |
$2.45 |
$2.56 |
$2.67 |
$2.58 |
$2.66 |
$2.79 |
|
Total Gross Income |
$18.61 |
$19.07 |
$18.74 |
$19.02 |
$19.40 |
$20.92 |
$21.57 |
$22.08 |
$22.73 |
$23.46 |
|
Less: Vacancy & Credit Loss |
1.13 |
0.00 |
0.74 |
0.34 |
0.00 |
2.65 |
0.19 |
0.89 |
0.10 |
0.21 |
|
Effective Income |
$17.47 |
$19.07 |
$17.99 |
$18.68 |
$19.40 |
$18.27 |
$21.39 |
$21.19 |
$22.63 |
$23.26 |
|
Less: Operating Expenses |
|
|
|
|
|
|
|
|
|
|
|
Maintenance |
0.57 |
0.59 |
0.60 |
0.62 |
0.64 |
0.66 |
0.68 |
0.70 |
0.72 |
0.74 |
|
Insurance |
0.23 |
0.24 |
0.25 |
0.27 |
0.28 |
0.29 |
0.31 |
0.32 |
0.34 |
0.36 |
|
Property Taxes |
2.00 |
2.04 |
2.08 |
2.12 |
2.16 |
2.21 |
2.25 |
2.30 |
2.34 |
2.39 |
|
Security |
0.15 |
0.15 |
0.16 |
0.16 |
0.17 |
0.17 |
0.18 |
0.18 |
0.19 |
0.20 |
|
Utilities |
0.17 |
0.18 |
0.18 |
0.19 |
0.19 |
0.20 |
0.20 |
0.21 |
0.22 |
0.22 |
|
Management Fee |
0.70 |
0.72 |
0.74 |
0.76 |
0.79 |
0.81 |
0.84 |
0.86 |
0.89 |
0.91 |
|
Total Operating Expenses |
$3.82 |
$3.92 |
$4.02 |
$4.13 |
$4.23 |
$4.34 |
$4.46 |
$4.58 |
$4.70 |
$4.82 |
|
Net Operating Income |
$13.65 |
$15.15 |
$13.97 |
$14.55 |
$15.16 |
$13.93 |
$16.93 |
$16.61 |
$17.94 |
$18.44 |
|
Less: Debt Service |
|
|
|
|
|
|
|
|
|
|
|
Loan |
11.38 |
11.38 |
11.38 |
11.38 |
11.38 |
11.38 |
11.38 |
11.38 |
11.38 |
11.38 |
|
Total Debt Service |
$11.38 |
$11.38 |
$11.38 |
$11.38 |
$11.38 |
$11.38 |
$11.38 |
$11.38 |
$11.38 |
$11.38 |
|
Net Operating Cash Flow |
$2.28 |
$3.77 |
$2.59 |
$3.17 |
$3.79 |
$2.55 |
$5.55 |
$5.23 |
$6.56 |
$7.06 |
|
Less: Capital Spending |
|
|
|
|
|
|
|
|
|
|
|
Market TI's |
0.61 |
0.00 |
5.05 |
0.11 |
0.11 |
3.13 |
0.12 |
5.99 |
0.06 |
0.00 |
|
Market Commissions |
0.30 |
0.00 |
0.56 |
0.05 |
0.05 |
1.15 |
0.06 |
0.71 |
0.03 |
0.00 |
|
Total Capital Spending |
$0.92 |
$0.00 |
$5.61 |
$0.16 |
$0.17 |
$4.28 |
$0.18 |
$6.71 |
$0.09 |
$0.00 |
|
Cash Flow Before Tax |
$1.36 |
$3.77 |
($3.02) |
$3.01 |
$3.62 |
($1.73) |
$5.37 |
($1.47) |
$6.46 |
$7.06 |
|
|
|
|
Base Rental Revenue Detail
Retail - Office
|
|
2008 |
2009 |
2010 |
2011 |
2012 |
2013 |
2014 |
2015 |
2016 |
2017 |
|
201 Office |
120.0 |
123.6 |
141.4 |
145.3 |
149.7 |
154.2 |
158.8 |
163.9 |
168.5 |
173.5 |
|
102 Drug Store |
94.5 |
94.5 |
99.2 |
99.2 |
99.2 |
119.9 |
122.7 |
126.4 |
130.2 |
134.1 |
|
103 Beauty Salon |
31.5 |
33.0 |
34.0 |
34.5 |
34.2 |
35.2 |
36.3 |
37.4 |
38.5 |
39.7 |
|
104 Donuts |
29.4 |
31.3 |
32.3 |
33.2 |
34.2 |
35.2 |
36.3 |
37.5 |
38.5 |
39.7 |
|
105 Flowers |
14.5 |
14.5 |
15.5 |
16.5 |
16.5 |
17.2 |
18.2 |
18.7 |
19.3 |
19.8 |
|
|
|
|
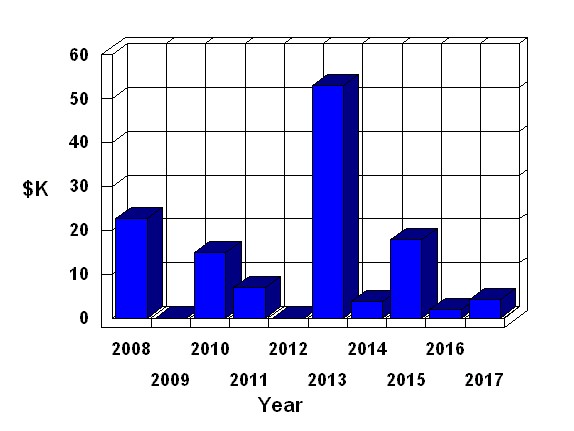
Vacancy & Credit Loss
Retail - Office
|
|
2008 |
2009 |
2010 |
2011 |
2012 |
2013 |
2014 |
2015 |
2016 |
2017 |
|
|
22.7 |
0.0 |
14.9 |
6.9 |
0.0 |
53.0 |
3.8 |
17.9 |
2.0 |
4.1 |
|
|
|
|
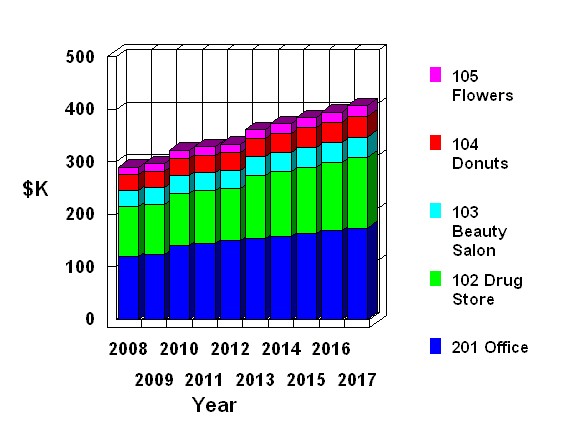
Base Rental Revenue
Retail - Office
This graph shows the percentage of Effective Income coming from base revenue vs reimbursements.
|
|
2008 |
2009 |
2010 |
2011 |
2012 |
2013 |
2014 |
2015 |
2016 |
2017 |
|
Base Rental Revenue |
289.9 |
296.9 |
322.3 |
328.8 |
333.9 |
361.8 |
372.3 |
383.9 |
395.0 |
406.8 |
|
Total Reimbursements |
78.2 |
80.2 |
47.8 |
46.8 |
48.9 |
51.2 |
53.4 |
51.7 |
53.3 |
55.8 |
|
Vacancy & Credit Loss |
22.7 |
0.0 |
14.9 |
6.9 |
0.0 |
53.0 |
3.8 |
17.9 |
2.0 |
4.1 |
|
|
|
|
Adj Capitalization Rate
Retail - Office
Adj Capitalization Rate is Net Operating Income divided by the Price of Property at Acquisition adjusted for additional investments and dispositions made since acquisition. Additional Investments includes any and all TI's and Commissions scheduled due to the use of Market Profiles.
|
|
2008 |
2009 |
2010 |
2011 |
2012 |
2013 |
2014 |
2015 |
2016 |
2017 |
|
Net Operating Income |
273.1 |
303.0 |
279.4 |
291.0 |
303.3 |
278.5 |
338.5 |
332.2 |
358.7 |
368.7 |
|
Total Capital Spending |
18.3 |
0.0 |
112.3 |
3.3 |
3.3 |
85.6 |
3.6 |
134.1 |
1.9 |
0.0 |
|
|
|
|
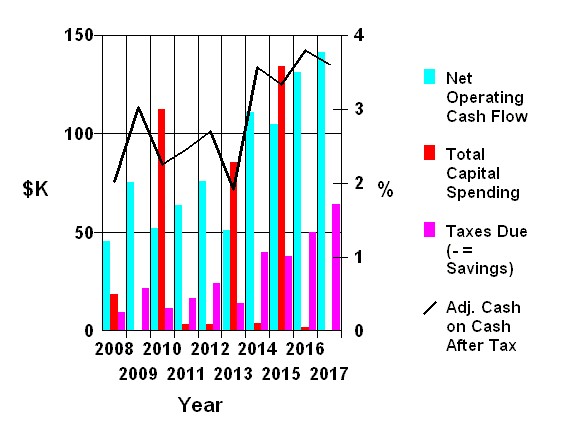
Adj Cash on Cash After Tax
Retail - Office
Adj Cash on Cash After Tax is Net Operating Cash Flow less Taxes Due divided by Initial Equity adjusted both for additional investments and dispositions made since acquisition, and for additional loans and loan repayments since acquisition.
|
|
2008 |
2009 |
2010 |
2011 |
2012 |
2013 |
2014 |
2015 |
2016 |
2017 |
|
Net Operating Cash Flow |
45.5 |
75.4 |
51.9 |
63.5 |
75.7 |
50.9 |
111.0 |
104.7 |
131.1 |
141.2 |
|
Total Capital Spending |
18.3 |
0.0 |
112.3 |
3.3 |
3.3 |
85.6 |
3.6 |
134.1 |
1.9 |
0.0 |
|
Taxes Due (- = Savings) |
9.6 |
21.4 |
11.5 |
16.5 |
24.1 |
14.2 |
39.7 |
37.9 |
50.1 |
64.2 |
|
|
|
|
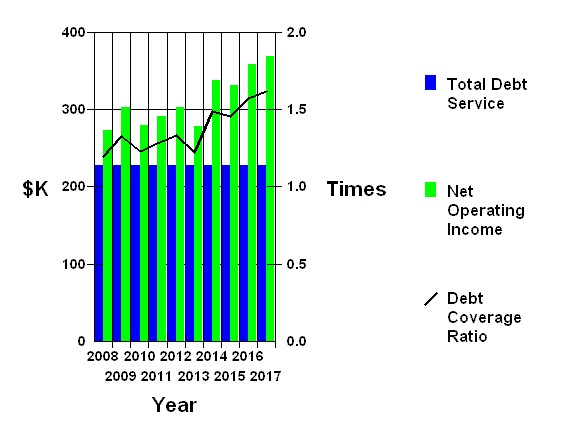
Debt Coverage Ratio
Retail - Office
Debt Coverage Ratio is the Net Operating Income divided by Debt Service, measuring the margin of safety for the lender in assuring that money will be available to service his loan. The debt coverage ratio takes the current year Net Operating Income and divides it by the current year Debt Service. If the Net Operating Income is greater than the Debt Service the Debt Coverage Ratio will be greater than 1.
|
|
2008 |
2009 |
2010 |
2011 |
2012 |
2013 |
2014 |
2015 |
2016 |
2017 |
|
Total Debt Service |
227.6 |
227.6 |
227.6 |
227.6 |
227.6 |
227.6 |
227.6 |
227.6 |
227.6 |
227.6 |
|
Net Operating Income |
273.1 |
303.0 |
279.4 |
291.0 |
303.3 |
278.5 |
338.5 |
332.2 |
358.7 |
368.7 |
|
|
|
|
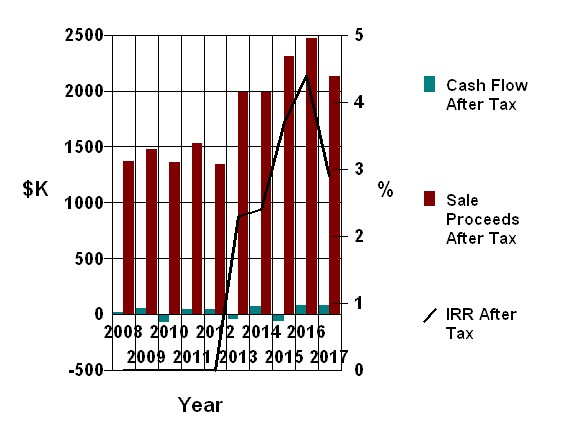
IRR After Tax
Retail - Office
Internal Rate of Return
(IRR)
The Internal Rate of Return (IRR) of an investment is defined as the Present
Value Discount Rate that makes the Net Present Value of the Investment equal to
zero.
You may think of the IRR as the annual Interest Rate or Yield (compounded
annually) that the investment is paying you over the Holding Period. Naturally,
the higher the yield, the better the investment.
Unlike the ratios (current year only) the IRR takes into account all the before
tax cash flows up to the time of calculation. For this reason the IRR is
sometimes called the time value of money, because it not only takes into
account the value but also the time necessary to create the value. In addition
to the Cash Flow After Tax and the Sales Proceeds After Tax the initial equity
is included in this measure.
|
|
2008 |
2009 |
2010 |
2011 |
2012 |
2013 |
2014 |
2015 |
2016 |
2017 |
|
Cash Flow After Tax |
17.6 |
54.0 |
-72.0 |
43.7 |
48.3 |
-48.8 |
67.6 |
-67.4 |
79.2 |
77.0 |
|
Sale Proceeds After Tax |
1,369.5 |
1,482.3 |
1,362.3 |
1,532.1 |
1,341.2 |
1,989.0 |
1,989.7 |
2,313.3 |
2,467.8 |
2,132.6 |
|
|
|
|
2013 Proforma Annual Statement
Retail - Office
This Statement is for the Retail - Office as acquired on 1 January 2008 for a Price of $4,000,000, subject to a Loan of $2,267,138, for a Down Payment of $1,732,862.
|
Sale Value |
$4,231,700 |
|
Less: Sale Costs (7%) |
296,219 |
|
Less: Loan Repayment |
1,912,932 |
|
Sale Proceeds Before Tax |
2,022,549 |
|
Less: Taxes due to Sale |
33,548 |
|
Sale Proceeds After Tax |
1,989,001 |
|
Price |
$4,000,000 |
|
-Loans |
2,267,138 |
|
Down Payment |
1,732,862 |
|
+Acq Costs |
20,000 |
|
+Loan Points |
22,671 |
|
Investment |
1,775,534 |
|
|
$/SqFt |
% of GI |
Annual $ |
|
Gross Income |
|
|
|
|
201 Office (10,000 sf) |
15.42 |
36.9% |
154,189 |
|
102 Drug Store (7,500 sf) |
15.99 |
28.7% |
119,902 |
|
103 Beauty Salon (2,000 sf) |
17.62 |
8.4% |
35,244 |
|
104 Donuts (2,000 sf) |
17.62 |
8.4% |
35,242 |
|
105 Flowers (1,000 sf) |
17.21 |
4.1% |
17,210 |
|
Base Rental Revenue |
$18.09 |
86.5% |
$361,786 |
|
Percentage Rent |
$0.27 |
1.3% |
$5,457 |
|
Total Reimbursements |
$2.56 |
12.2% |
$51,155 |
|
Total Gross Income |
$20.92 |
100.0% |
$418,398 |
|
Less: Vacancy & Credit Loss |
2.65 |
12.7% |
52,992 |
|
Effective Income |
$18.27 |
87.3% |
$365,407 |
|
Less: Operating Expenses |
|
|
|
|
Maintenance |
0.66 |
3.2% |
13,216 |
|
Insurance |
0.29 |
1.4% |
5,871 |
|
Property Taxes |
2.21 |
10.6% |
44,163 |
|
Security |
0.17 |
0.8% |
3,478 |
|
Utilities |
0.20 |
0.9% |
3,942 |
|
Management Fee |
0.81 |
3.9% |
16,230 |
|
Total Operating Expenses |
$4.34 |
20.8% |
$86,899 |
|
Net Operating Income |
$13.93 |
66.6% |
$278,508 |
|
Less: Debt Service |
|
|
|
|
Loan |
11.38 |
54.4% |
227,559 |
|
Total Debt Service |
$11.38 |
54.4% |
$227,559 |
|
Net Operating Cash Flow |
$2.55 |
12.2% |
$50,949 |
|
Less: Capital Spending |
|
|
|
|
Market TI's |
3.13 |
15.0% |
62,644 |
|
Market Commissions |
1.15 |
5.5% |
22,907 |
|
Total Capital Spending |
$4.28 |
20.4% |
$85,551 |
|
Cash Flow Before Tax |
($1.73) |
(8.3%) |
($34,603) |
|
Taxable Income and Taxes |
|
|
|
|
(Losses Taken Currently) |
|
|
|
|
Taxable Revenues |
$18.27 |
87.3% |
$365,407 |
|
Less: Deducted Expenses |
4.34 |
20.8% |
86,899 |
|
Less: Interest Expense |
7.81 |
37.3% |
156,166 |
|
Less: Amortized Points |
0.06 |
0.3% |
1,134 |
|
Less: Depreciation |
4.35 |
20.8% |
86,999 |
|
Ordinary Income |
$1.71 |
8.2% |
$34,210 |
|
Taxable Income |
1.71 |
8.2% |
34,210 |
|
Taxes Due (- = Savings) |
0.71 |
3.4% |
14,197 |
|
Cash Flow After Tax |
($2.44) |
(11.7%) |
($48,800) |
|
Capitalization Rate |
6.96% |
|
Adj. Capitalization Rate |
6.73% |
|
Cash on Cash Before Tax |
2.87% |
|
Adj. Cash on Cash Before Tax |
2.66% |
|
Cash on Cash After Tax |
2.07% |
|
Adj. Cash on Cash After Tax |
1.92% |
|
Debt Coverage Ratio |
1.224 |
|
Breakeven Occupancy |
75.2% |
|
Loan Balance/Property Value |
45.2% |
|
NOI/Property Value |
6.58% |
|
Operating Expense Ratio |
20.8% |
|
IRR Before Debt |
6.2% |
|
IRR Before Tax |
3.5% |
|
IRR After Tax |
2.3% |
|
NPV Before Debt @10.00% |
($649,628) |
|
NPV Before Tax @10.00% |
($524,805) |
|
NPV After Tax @10.00% |
($617,895) |
|
|
|
|
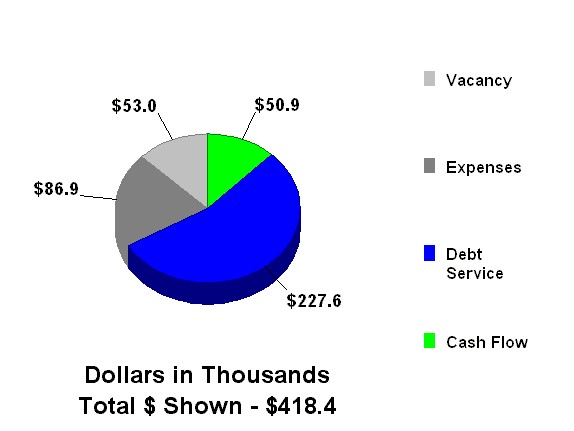
2013 Use of Gross Income
Retail - Office
|
|
|
|
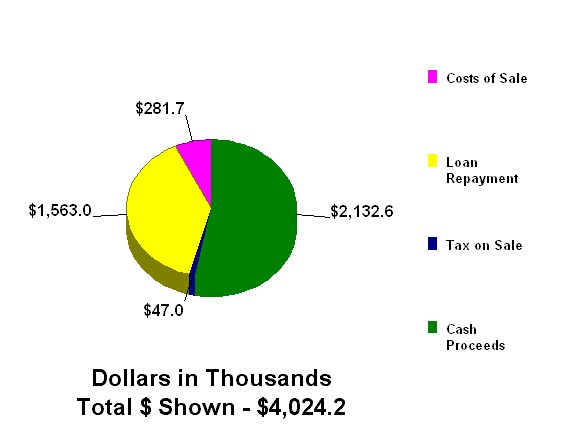
Property Sale Report
Retail - Office
This report shows the results of a projected sale of the Retail - Office on 31 December 2017. The Sale Price of $4,024,231 is projected by using a Net Capitalization Rate of 8% on the Net Operating Income of $321,938 projected to be received during the next 12 months, according to the analysis assumptions.
|
Analysis of Sale Proceeds |
|
|
|
|
Sale Price (as discussed above) |
$4,024,231 |
|
|
|
- Costs of Sale (7%) |
281,696 |
|
|
|
- Loan Balances |
1,562,979 |
|
|
|
- Prepayment Penalties |
0 |
|
|
|
Sale Proceeds Before Tax |
|
|
$2,179,556 |
|
|
|
|
|
|
Analysis of Capital Gain Results |
|
|
|
|
Sale Price |
$4,024,231 |
|
|
|
- Capitalized Costs of Sale (100%) |
281,696 |
|
|
|
Net Sale Price for Tax Purposes |
|
$3,742,535 |
|
|
|
|
|
|
|
Property Basis at Acquisition |
$4,000,000 |
|
|
|
+ Capitalized Closing Costs (100%) |
20,000 |
|
|
|
+ Capital Additions |
362,387 |
|
|
|
- Depreciation Taken |
846,505 |
|
|
|
+ Excess Depreciation Recaptured |
0 |
|
|
|
Adjusted Basis at Sale |
|
3,535,882 |
|
|
Capital Gain (or Loss) |
|
$206,652 |
|
|
- Suspended Passive Losses |
|
0 |
|
|
Net Capital Gain (or Loss) |
|
$206,652 |
|
|
- Cost Recovery Recaptured |
|
206,652 |
|
|
Adjusted Net Capital Gain (or Loss) |
|
$0 |
|
|
Cost Recovery Recapture Tax (@ 25%) |
|
|
(51,663) |
|
Tax on Adjusted Net Capital Gain (@ 15%) |
|
|
0 |
|
|
|
|
|
|
Expenses Recognized at Sale |
|
|
|
|
Expensed Costs of Sale |
0 |
|
|
|
+ Accrued Loan Interest |
0 |
|
|
|
+ Unamortized Points |
11,336 |
|
|
|
+ Prepayment Penalties |
0 |
|
|
|
- Excess Depreciation Recaptured |
0 |
|
|
|
Total Expenses Recognized at Sale |
|
11,336 |
|
|
Tax Savings Due to Sale Expenses (@ 41.5%) |
|
|
4,704 |
|
Net Taxable Income |
|
$195,317 |
|
|
After Tax Cash Proceeds of Sale |
|
|
$2,132,597 |
|
|
|
|
Sale Proceeds After Tax
Retail - Office
|
|
|
|
Lease Analysis Summary
Retail - Office
|
Name |
Suite |
RSF |
Total $ |
PV @ 10% |
PV/RSF |
|
Office |
201 |
10,000 |
1,316,498 |
836,167 |
83.62 |
|
Drug Store |
102 |
7,500 |
1,325,009 |
829,618 |
110.62 |
|
Beauty Salon |
103 |
2,000 |
377,810 |
229,793 |
114.90 |
|
Donuts |
104 |
2,000 |
403,673 |
252,855 |
126.43 |
|
Flowers |
105 |
1,000 |
201,480 |
127,250 |
127.25 |
|
|
|
|
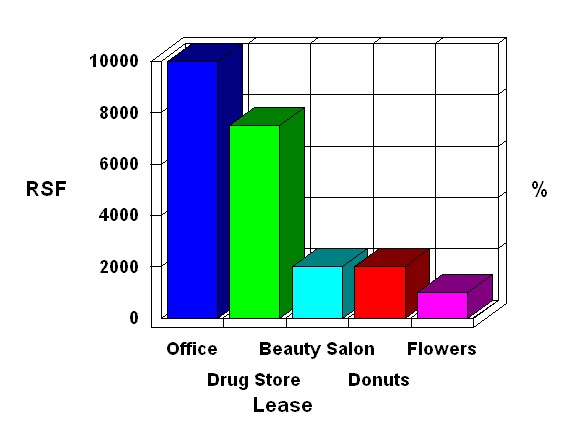
Rentable Square Feet Comparison
Retail - Office
|
|
Office |
Drug Store |
Beauty Salon |
Donuts |
Flowers |
|
|
10,000.0 |
7,500.0 |
2,000.0 |
2,000.0 |
1,000.0 |
|
|
|
|
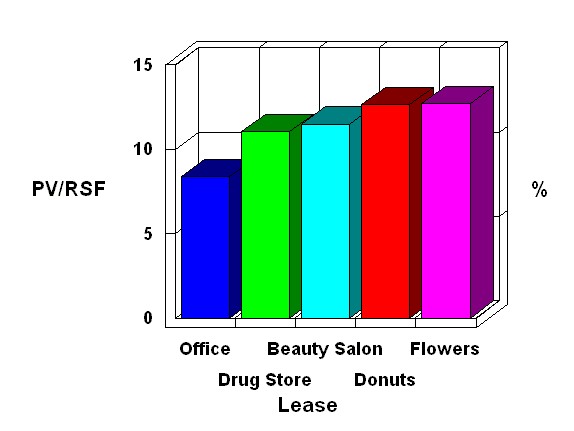
PV/Year/RSF Comparison
Retail - Office
|
|
Office |
Drug Store |
Beauty Salon |
Donuts |
Flowers |
|
|
8.4 |
11.1 |
11.5 |
12.6 |
12.7 |
|
|
|
|
Lease Analysis
Office
|
|
|
Measure |
Rent |
Rentable |
Usable |
|
Report Date |
18 Apr 08 |
Total Effective |
1,316,498 |
131.65 |
|
|
Suite |
201 |
Avg Annual Effective |
131,650 |
13.16 |
|
|
Rentable SF |
10,000 |
PV @ 10% |
836,167 |
83.62 |
|
|
Usable SF |
|
Annual PV @ 10% |
83,617 |
8.36 |
|
|
|
2008 |
2009 |
2010 |
2011 |
2012 |
2013 |
2014 |
2015 |
2016 |
2017 |
Total |
|
Base Rent |
120,000 |
123,600 |
0 |
0 |
0 |
0 |
0 |
0 |
0 |
0 |
243,600 |
|
To Market |
0 |
0 |
129,660 |
145,338 |
149,698 |
154,189 |
158,814 |
150,251 |
168,491 |
173,545 |
1,229,985 |
|
Market TI's |
0 |
0 |
(101,034) |
0 |
0 |
0 |
0 |
(117,415) |
0 |
0 |
(218,449) |
|
Market Commissions |
0 |
0 |
(11,264) |
0 |
0 |
0 |
0 |
(13,091) |
0 |
0 |
(24,355) |
|
Reimb Maintenance |
3,567 |
3,719 |
0 |
161 |
327 |
498 |
675 |
71 |
187 |
379 |
9,585 |
|
Reimb Insurance |
2,711 |
2,813 |
0 |
113 |
231 |
355 |
486 |
52 |
144 |
295 |
7,200 |
|
Reimb Property Taxes |
18,444 |
18,800 |
0 |
370 |
747 |
1,132 |
1,525 |
160 |
408 |
825 |
42,412 |
|
Reimb Security |
2,000 |
2,040 |
0 |
42 |
86 |
131 |
178 |
19 |
49 |
100 |
4,645 |
|
Reimb Utilities |
2,178 |
2,223 |
0 |
48 |
98 |
149 |
201 |
21 |
56 |
113 |
5,087 |
|
Reimb Management Fee |
6,889 |
7,076 |
0 |
198 |
402 |
612 |
829 |
88 |
230 |
466 |
16,788 |
|
Total $ |
155,789 |
160,271 |
17,362 |
146,270 |
151,589 |
157,066 |
162,707 |
20,156 |
169,564 |
175,724 |
1,316,498 |
|
Total PV |
148,595 |
138,972 |
10,088 |
104,809 |
98,746 |
93,012 |
87,593 |
7,848 |
75,435 |
71,069 |
836,167 |
|
$/RSF |
15.58 |
16.03 |
1.74 |
14.63 |
15.16 |
15.71 |
16.27 |
2.02 |
16.96 |
17.57 |
131.65 |
|
PV/RSF |
14.86 |
13.90 |
1.01 |
10.48 |
9.87 |
9.30 |
8.76 |
0.78 |
7.54 |
7.11 |
83.62 |
|
|
|
|
Lease Analysis
Drug Store
|
|
|
Measure |
Rent |
Rentable |
Usable |
|
Report Date |
18 Apr 08 |
Total Effective |
1,325,009 |
176.67 |
|
|
Suite |
102 |
Avg Annual Effective |
132,501 |
17.67 |
|
|
Rentable SF |
7,500 |
PV @ 10% |
829,618 |
110.62 |
|
|
Usable SF |
|
Annual PV @ 10% |
82,962 |
11.06 |
|
|
|
2008 |
2009 |
2010 |
2011 |
2012 |
2013 |
2014 |
2015 |
2016 |
2017 |
Total |
|
Base Rent |
94,500 |
94,500 |
0 |
0 |
0 |
0 |
0 |
0 |
0 |
0 |
189,000 |
|
Continued |
0 |
0 |
99,225 |
99,225 |
99,225 |
0 |
0 |
0 |
0 |
0 |
297,675 |
|
To Market |
0 |
0 |
0 |
0 |
0 |
80,197 |
122,701 |
126,382 |
130,173 |
134,078 |
593,531 |
|
Market TI's |
0 |
0 |
0 |
0 |
0 |
(61,465) |
0 |
0 |
0 |
0 |
(61,465) |
|
Market Commissions |
0 |
0 |
0 |
0 |
0 |
(22,353) |
0 |
0 |
0 |
0 |
(22,353) |
|
Percentage Rent |
4,000 |
4,280 |
4,566 |
4,857 |
5,154 |
3,638 |
5,766 |
6,082 |
6,403 |
6,731 |
51,477 |
|
Reimb Maintenance |
3,800 |
3,914 |
4,031 |
4,152 |
4,277 |
2,937 |
4,537 |
4,674 |
4,814 |
4,958 |
42,094 |
|
Reimb Insurance |
1,533 |
1,610 |
1,691 |
1,775 |
1,864 |
1,305 |
2,055 |
2,158 |
2,265 |
2,379 |
18,634 |
|
Reimb Property Taxes |
13,333 |
13,600 |
13,872 |
14,149 |
14,432 |
9,814 |
15,015 |
15,316 |
15,622 |
15,935 |
141,089 |
|
Reimb Security |
1,000 |
1,030 |
1,061 |
1,093 |
1,126 |
773 |
1,194 |
1,230 |
1,267 |
1,305 |
11,077 |
|
Reimb Utilities |
1,133 |
1,167 |
1,202 |
1,238 |
1,276 |
876 |
1,353 |
1,394 |
1,436 |
1,479 |
12,554 |
|
Reimb Management Fee |
4,667 |
4,807 |
4,951 |
5,099 |
5,252 |
3,607 |
5,572 |
5,739 |
5,912 |
6,089 |
51,695 |
|
Total $ |
123,967 |
124,908 |
130,599 |
131,589 |
132,606 |
19,328 |
158,194 |
162,973 |
167,892 |
172,954 |
1,325,009 |
|
Total PV |
118,242 |
108,309 |
102,949 |
94,299 |
86,389 |
9,895 |
85,152 |
79,750 |
74,688 |
69,945 |
829,618 |
|
$/RSF |
16.53 |
16.65 |
17.41 |
17.55 |
17.68 |
2.58 |
21.09 |
21.73 |
22.39 |
23.06 |
176.67 |
|
PV/RSF |
15.77 |
14.44 |
13.73 |
12.57 |
11.52 |
1.32 |
11.35 |
10.63 |
9.96 |
9.33 |
110.62 |
|
|
|
|
Lease Analysis
Beauty Salon
|
|
|
Measure |
Rent |
Rentable |
Usable |
|
Report Date |
18 Apr 08 |
Total Effective |
377,810 |
188.91 |
|
|
Suite |
103 |
Avg Annual Effective |
37,781 |
18.89 |
|
|
Rentable SF |
2,000 |
PV @ 10% |
229,793 |
114.90 |
|
|
Usable SF |
|
Annual PV @ 10% |
22,979 |
11.49 |
|
|
|
2008 |
2009 |
2010 |
2011 |
2012 |
2013 |
2014 |
2015 |
2016 |
2017 |
Total |
|
Base Rent |
7,250 |
0 |
0 |
0 |
0 |
0 |
0 |
0 |
0 |
0 |
7,250 |
|
To Market |
8,179 |
32,963 |
33,952 |
31,707 |
34,218 |
35,244 |
33,209 |
37,389 |
38,511 |
36,270 |
321,642 |
|
Market TI's |
(10,224) |
0 |
0 |
(2,240) |
0 |
0 |
(2,454) |
0 |
0 |
0 |
(14,918) |
|
Market Commissions |
(5,056) |
0 |
0 |
(1,052) |
0 |
0 |
(1,153) |
0 |
0 |
0 |
(7,261) |
|
Reimb Maintenance |
507 |
1,044 |
1,075 |
1,015 |
1,141 |
1,175 |
1,109 |
1,246 |
1,284 |
1,212 |
10,807 |
|
Reimb Insurance |
204 |
429 |
451 |
434 |
497 |
522 |
502 |
575 |
604 |
581 |
4,801 |
|
Reimb Property Taxes |
1,778 |
3,627 |
3,699 |
3,459 |
3,849 |
3,926 |
3,670 |
4,084 |
4,166 |
3,895 |
36,152 |
|
Reimb Security |
133 |
275 |
283 |
267 |
300 |
309 |
292 |
328 |
338 |
319 |
2,844 |
|
Reimb Utilities |
151 |
311 |
321 |
303 |
340 |
350 |
331 |
372 |
383 |
361 |
3,223 |
|
Reimb Management Fee |
622 |
1,282 |
1,320 |
1,247 |
1,401 |
1,443 |
1,362 |
1,531 |
1,576 |
1,488 |
13,271 |
|
Total $ |
3,544 |
39,930 |
41,100 |
35,139 |
41,745 |
42,968 |
36,869 |
45,525 |
46,862 |
44,128 |
377,810 |
|
Total PV |
3,759 |
34,616 |
32,392 |
25,338 |
27,191 |
25,444 |
20,002 |
22,281 |
20,850 |
17,920 |
229,793 |
|
$/RSF |
1.77 |
19.97 |
20.55 |
17.57 |
20.87 |
21.48 |
18.43 |
22.76 |
23.43 |
22.06 |
188.91 |
|
PV/RSF |
1.88 |
17.31 |
16.20 |
12.67 |
13.60 |
12.72 |
10.00 |
11.14 |
10.43 |
8.96 |
114.90 |
|
|
|
|
Lease Analysis
Donuts
|
|
|
Measure |
Rent |
Rentable |
Usable |
|
Report Date |
18 Apr 08 |
Total Effective |
403,673 |
201.84 |
|
|
Suite |
104 |
Avg Annual Effective |
40,367 |
20.18 |
|
|
Rentable SF |
2,000 |
PV @ 10% |
252,855 |
126.43 |
|
|
Usable SF |
|
Annual PV @ 10% |
25,286 |
12.64 |
|
|
|
2008 |
2009 |
2010 |
2011 |
2012 |
2013 |
2014 |
2015 |
2016 |
2017 |
Total |
|
Base Rent |
24,167 |
0 |
0 |
0 |
0 |
0 |
0 |
0 |
0 |
0 |
24,167 |
|
To Market |
2,603 |
31,313 |
32,252 |
30,376 |
34,215 |
35,242 |
36,299 |
34,357 |
38,511 |
39,666 |
314,835 |
|
Market TI's |
(2,055) |
0 |
0 |
0 |
(2,251) |
0 |
0 |
(2,466) |
0 |
0 |
(6,772) |
|
Market Commissions |
(965) |
0 |
0 |
0 |
(1,058) |
0 |
0 |
(1,158) |
0 |
0 |
(3,181) |
|
Reimb Maintenance |
929 |
1,044 |
1,075 |
1,015 |
1,141 |
1,175 |
1,210 |
1,142 |
1,284 |
1,322 |
11,336 |
|
Reimb Insurance |
375 |
429 |
451 |
434 |
497 |
522 |
548 |
527 |
604 |
634 |
5,021 |
|
Reimb Property Taxes |
3,259 |
3,627 |
3,699 |
3,459 |
3,849 |
3,926 |
4,004 |
3,744 |
4,166 |
4,249 |
37,981 |
|
Reimb Security |
244 |
275 |
283 |
267 |
300 |
309 |
318 |
301 |
338 |
348 |
2,983 |
|
Reimb Utilities |
277 |
311 |
321 |
303 |
340 |
350 |
361 |
341 |
383 |
394 |
3,381 |
|
Reimb Management Fee |
1,141 |
1,282 |
1,320 |
1,247 |
1,401 |
1,443 |
1,486 |
1,403 |
1,576 |
1,624 |
13,922 |
|
Total $ |
29,974 |
38,281 |
39,401 |
37,100 |
38,434 |
42,966 |
44,226 |
38,191 |
46,862 |
48,238 |
403,673 |
|
Total PV |
28,808 |
33,191 |
31,057 |
26,691 |
24,943 |
25,447 |
23,812 |
18,547 |
20,850 |
19,511 |
252,855 |
|
$/RSF |
14.99 |
19.14 |
19.70 |
18.55 |
19.22 |
21.48 |
22.11 |
19.10 |
23.43 |
24.12 |
201.84 |
|
PV/RSF |
14.40 |
16.60 |
15.53 |
13.35 |
12.47 |
12.72 |
11.91 |
9.27 |
10.43 |
9.76 |
126.43 |
|
|
|
|
Lease Analysis
Flowers
|
|
|
Measure |
Rent |
Rentable |
Usable |
|
Report Date |
18 Apr 08 |
Total Effective |
201,480 |
201.48 |
|
|
Suite |
105 |
Avg Annual Effective |
20,148 |
20.15 |
|
|
Rentable SF |
1,000 |
PV @ 10% |
127,250 |
127.25 |
|
|
Usable SF |
|
Annual PV @ 10% |
12,725 |
12.73 |
|
|
|
2008 |
2009 |
2010 |
2011 |
2012 |
2013 |
2014 |
2015 |
2016 |
2017 |
Total |
|
Base Rent |
14,500 |
14,500 |
7,250 |
0 |
0 |
0 |
0 |
0 |
0 |
0 |
36,250 |
|
Continued |
0 |
0 |
8,250 |
16,500 |
16,500 |
8,250 |
0 |
0 |
0 |
0 |
49,500 |
|
To Market |
0 |
0 |
0 |
0 |
0 |
7,470 |
18,152 |
18,696 |
17,641 |
19,834 |
81,792 |
|
Market TI's |
0 |
0 |
0 |
0 |
0 |
(1,179) |
0 |
0 |
(1,292) |
0 |
(2,471) |
|
Market Commissions |
0 |
0 |
0 |
0 |
0 |
(554) |
0 |
0 |
(607) |
0 |
(1,161) |
|
Reimb Maintenance |
507 |
522 |
538 |
554 |
570 |
538 |
605 |
623 |
588 |
661 |
5,706 |
|
Reimb Insurance |
204 |
215 |
225 |
237 |
249 |
239 |
274 |
288 |
277 |
317 |
2,525 |
|
Reimb Property Taxes |
1,778 |
1,813 |
1,850 |
1,887 |
1,924 |
1,799 |
2,002 |
2,042 |
1,909 |
2,125 |
19,129 |
|
Reimb Security |
133 |
137 |
141 |
146 |
150 |
142 |
159 |
164 |
155 |
174 |
1,502 |
|
Reimb Utilities |
151 |
156 |
160 |
165 |
170 |
161 |
180 |
186 |
175 |
197 |
1,702 |
|
Reimb Management Fee |
622 |
641 |
660 |
680 |
700 |
661 |
743 |
765 |
723 |
812 |
7,007 |
|
Total $ |
17,896 |
17,984 |
19,074 |
20,168 |
20,264 |
17,527 |
22,115 |
22,764 |
19,569 |
24,120 |
201,480 |
|
Total PV |
17,069 |
15,594 |
15,017 |
14,453 |
13,201 |
10,387 |
11,904 |
11,139 |
8,732 |
9,754 |
127,250 |
|
$/RSF |
17.90 |
17.98 |
19.07 |
20.17 |
20.26 |
17.53 |
22.12 |
22.76 |
19.57 |
24.12 |
201.48 |
|
PV/RSF |
17.07 |
15.59 |
15.02 |
14.45 |
13.20 |
10.39 |
11.90 |
11.14 |
8.73 |
9.75 |
127.25 |
|
|
|
|
Reimbursements Assumptions
Retail - Office
|
Suite |
Tenant Name |
SqFt |
|
201 |
Office |
10,000 |
|
Expense |
Method |
Amount |
Prorata |
Min |
Max |
GU% |
|
Maintenance |
$ Stop |
$0.15/sf/yr |
None |
None |
None |
None |
|
Insurance |
$ Stop |
$0.15/sf/yr |
None |
None |
None |
None |
|
Property Taxes |
$ Stop |
$0.15/sf/yr |
None |
None |
None |
None |
|
Security |
$ Stop |
$0.15/sf/yr |
None |
None |
None |
None |
|
Utilities |
$ Stop |
$0.15/sf/yr |
None |
None |
None |
None |
|
Management Fee |
$ Stop |
$0.15/sf/yr |
None |
None |
None |
None |
|
Suite |
Tenant Name |
SqFt |
|
102 |
Drug Store |
7,500 |
|
Expense |
Method |
Amount |
Prorata |
Min |
Max |
GU% |
|
Maintenance |
Net |
None |
None |
None |
None |
None |
|
Insurance |
Net |
None |
None |
None |
None |
None |
|
Property Taxes |
Net |
None |
None |
None |
None |
None |
|
Security |
Net |
None |
None |
None |
None |
None |
|
Utilities |
Net |
None |
None |
None |
None |
None |
|
Management Fee |
Net |
None |
None |
None |
None |
None |
|
Suite |
Tenant Name |
SqFt |
|
103 |
Beauty Salon |
2,000 |
|
Expense |
Method |
Amount |
Prorata |
Min |
Max |
GU% |
|
Maintenance |
Net |
None |
None |
None |
None |
None |
|
Insurance |
Net |
None |
None |
None |
None |
None |
|
Property Taxes |
Net |
None |
None |
None |
None |
None |
|
Security |
Net |
None |
None |
None |
None |
None |
|
Utilities |
Net |
None |
None |
None |
None |
None |
|
Management Fee |
Net |
None |
None |
None |
None |
None |
|
Suite |
Tenant Name |
SqFt |
|
104 |
Donuts |
2,000 |
|
Expense |
Method |
Amount |
Prorata |
Min |
Max |
GU% |
|
Maintenance |
Net |
None |
None |
None |
None |
None |
|
Insurance |
Net |
None |
None |
None |
None |
None |
|
Property Taxes |
Net |
None |
None |
None |
None |
None |
|
Security |
Net |
None |
None |
None |
None |
None |
|
Utilities |
Net |
None |
None |
None |
None |
None |
|
Management Fee |
Net |
None |
None |
None |
None |
None |
|
Suite |
Tenant Name |
SqFt |
|
105 |
Flowers |
1,000 |
|
Expense |
Method |
Amount |
Prorata |
Min |
Max |
GU% |
|
Maintenance |
Net |
None |
None |
None |
None |
None |
|
Insurance |
Net |
None |
None |
None |
None |
None |
|
Property Taxes |
Net |
None |
None |
None |
None |
None |
|
Security |
Net |
None |
None |
None |
None |
None |
|
Utilities |
Net |
None |
None |
None |
None |
None |
|
Management Fee |
Net |
None |
None |
None |
None |
None |
|
|
|
|
Market Profile Assumptions
Retail - Office
Office is a Local Profile
|
|
General |
|
Renew |
New |
Avg |
|
Renewal Probability |
70.00% |
Market Rent |
$13.00/sf/yr |
$14.00/sf/yr |
$13.30/sf/yr |
|
Grow Rent |
Yes |
TI's |
$5.00/sf |
$20.00/sf |
$9.50/sf |
|
Growth Method |
%>Inflation |
Commissions |
None |
5.00% of Rent |
1.50% of Rent |
|
Growth Rate |
at the Inflation Rate |
Abatements |
None |
None |
None |
|
Lease Duration |
5.00 Years |
End Charges |
None |
None |
None |
|
Life - TI's |
15.00 Years |
Start Charges |
None |
None |
None |
|
Life - Commissions |
5.00 Years |
Months Vacant |
|
3.00 Months |
1 Month |
|
Year 1 TI's |
None |
|
|
|
|
|
Reimbursements |
Cont w/BY&$ adj |
|
|
|
|
Drug is a Local Profile
|
|
General |
|
Renew |
New |
Avg |
|
Renewal Probability |
30.00% |
Market Rent |
$13.00/sf/yr |
$14.00/sf/yr |
$13.70/sf/yr |
|
Grow Rent |
Yes |
TI's |
None |
$10.00/sf |
$7.00/sf |
|
Growth Method |
%>Inflation |
Commissions |
None |
5.00% of Rent |
3.50% of Rent |
|
Growth Rate |
at the Inflation Rate |
Abatements |
None |
None |
None |
|
Lease Duration |
5.00 Years |
End Charges |
None |
None |
None |
|
Life - TI's |
15.00 Years |
Start Charges |
None |
None |
None |
|
Life - Commissions |
5.00 Years |
Months Vacant |
|
6.00 Months |
4 Months |
|
Year 1 TI's |
None |
|
|
|
|
|
Reimbursements |
Continue |
|
|
|
|
Small is a Local Profile
|
|
General |
|
Renew |
New |
Avg |
|
Renewal Probability |
80.00% |
Market Rent |
$15.00/sf/yr |
$16.00/sf/yr |
$15.20/sf/yr |
|
Grow Rent |
Yes |
TI's |
None |
$5.00/sf |
$1.00/sf |
|
Growth Method |
%>Inflation |
Commissions |
None |
5.00% of Rent |
1.00% of Rent |
|
Growth Rate |
at the Inflation Rate |
Abatements |
None |
None |
None |
|
Lease Duration |
3.00 Years |
End Charges |
None |
None |
None |
|
Life - TI's |
15.00 Years |
Start Charges |
None |
None |
None |
|
Life - Commissions |
3.00 Years |
Months Vacant |
|
6.00 Months |
1 Month |
|
Year 1 TI's |
None |
|
|
|
|
|
Reimbursements |
Continue |
|
|
|
|
Beauty
is a Local Profile
|
|
General |
|
Renew |
New |
Avg |
|
Renewal Probability |
None |
Market Rent |
None |
$16.00/sf/yr |
$16.00/sf/yr |
|
Grow Rent |
Yes |
TI's |
None |
$5.00/sf |
$5.00/sf |
|
Growth Method |
%>Inflation |
Commissions |
None |
5.00% of Rent |
5.00% of Rent |
|
Growth Rate |
at the Inflation Rate |
Abatements |
None |
None |
None |
|
Lease Duration |
3.00 Years |
End Charges |
None |
None |
None |
|
Life - TI's |
15.00 Years |
Start Charges |
None |
None |
None |
|
Life - Commissions |
3.00 Years |
Months Vacant |
|
6.00 Months |
6 Months |
|
Year 1 TI's |
None |
|
|
|
|
|
Reimbursements |
Continue |
|
|
|
|
|
|
|
|
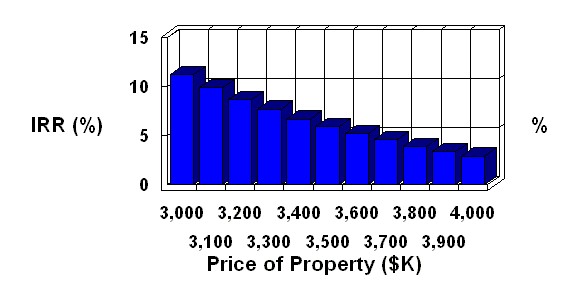
Sensitivity Analysis
Retail - Office
As you perform an analysis, planEASe measures the worth of the investment in terms of rates of return and net present values. Sensitivity Analysis allows you to investigate how these measures vary with a change in one of the assumptions. Any measure may be chosen for the Sensitivity Analysis, and any assumption may be chosen as well. Sensitivity Analysis provides a one page table and graph which describes the relationship between the assumption value and the resulting measure.
Price
of Property
versus
Rate of Return After Tax
|
Assumption |
IRR |
|
$3,000,000.00 |
11.2% |
|
$3,100,000.00 |
9.9% |
|
$3,200,000.00 |
8.7% |
|
$3,300,000.00 |
7.7% |
|
$3,400,000.00 |
6.7% |
|
$3,500,000.00 |
5.9% |
|
$3,600,000.00 |
5.2% |
|
$3,700,000.00 |
4.6% |
|
$3,800,000.00 |
3.9% |
|
$3,900,000.00 |
3.4% |
|
$4,000,000.00 |
2.9% |
|
|
|
|
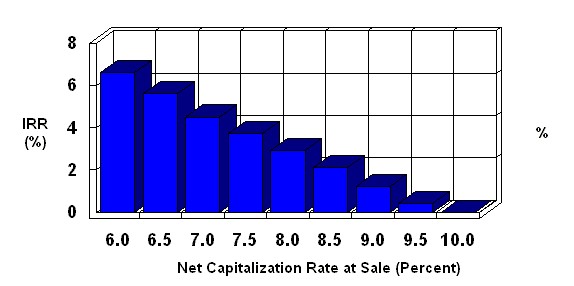
Sensitivity Analysis
Retail - Office
Net
Capitalization Rate at Sale
versus
Rate of Return After Tax
|
Assumption |
IRR |
|
6% Net Cap Rate |
6.6% |
|
6.5% Net Cap Rate |
5.6% |
|
7% Net Cap Rate |
4.5% |
|
7.5% Net Cap Rate |
3.7% |
|
8% Net Cap Rate |
2.9% |
|
8.5% Net Cap Rate |
2.1% |
|
9% Net Cap Rate |
1.2% |
|
9.5% Net Cap Rate |
0.4% |
|
10% Net Cap Rate |
0.0% |
|
|
|
|
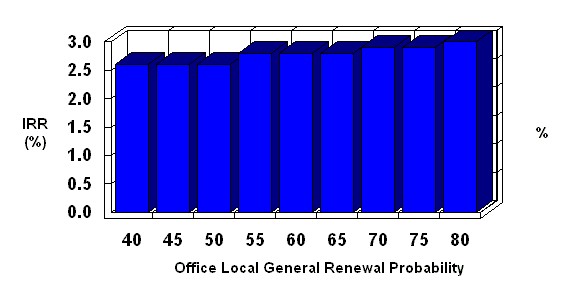
Sensitivity Analysis
Retail - Office
Office
Local General Renewal Probability
versus
Rate of Return After Tax
|
Assumption |
IRR |
|
40% |
2.6% |
|
45% |
2.6% |
|
50% |
2.6% |
|
55% |
2.8% |
|
60% |
2.8% |
|
65% |
2.8% |
|
70% |
2.9% |
|
75% |
2.9% |
|
80% |
3.0% |
|
|
|
|
Sensitivity Analysis
Retail - Office
Office
Local New Months Vacant
versus
Net Present Value After Tax @10%
|
Assumption |
NPV |
|
None |
(840,570) |
|
1.00 Months |
(840,570) |
|
2.00 Months |
(848,585) |
|
3.00 Months |
(848,585) |
|
4.00 Months |
(848,585) |
|
5.00 Months |
(856,562) |
|
6.00 Months |
(856,562) |
|
7.00 Months |
(856,562) |
|
8.00 Months |
(856,562) |
|
9.00 Months |
(864,503) |
|
10.00 Months |
(864,503) |
|
|
|
|
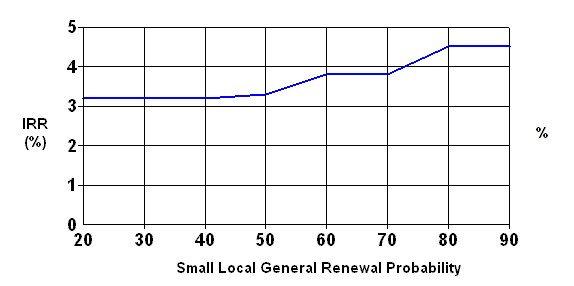
Sensitivity Analysis
Retail - Office
Small
Local General Renewal Probability
versus
Rate of Return Before Tax
|
Assumption |
IRR |
|
20% |
3.2% |
|
30% |
3.2% |
|
40% |
3.2% |
|
50% |
3.3% |
|
60% |
3.8% |
|
70% |
3.8% |
|
80% |
4.5% |
|
90% |
4.5% |
|
|
|
|
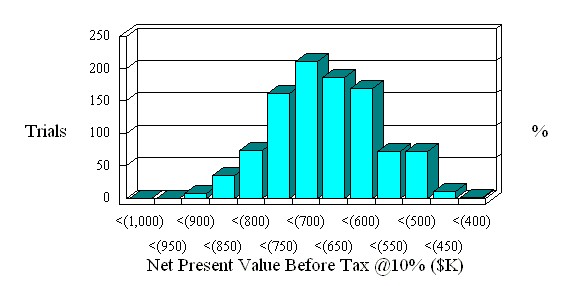
Risk Analysis
Retail - Office
|
Risk Analysis Assumption |
Lowest |
Likely |
Highest |
|
Net Capitalization Rate at Sale |
7% Net Cap Rate |
8% Net Cap Rate |
9% Net Cap Rate |
|
Office Local General Renewal Probability |
60% |
70% |
80% |
|
Office Local New Months Vacant |
2.00 Months |
3.00 Months |
4.00 Months |
|
Drug Local General Renewal Probability |
20% |
30% |
40% |
|
Drug Local New Months Vacant |
5.00 Months |
6.00 Months |
7.00 Months |
|
Small Local General Renewal Probability |
70% |
80% |
90% |
|
Small Local New Months Vacant |
5.00 Months |
6.00 Months |
7.00 Months |
|
Beauty Local New Months Vacant |
5.00 Months |
6.00 Months |
7.00 Months |
|
Average NPV |
(692,433) |
|
Lowest NPV |
(940,475) |
|
Standard Deviation |
91,466 |
|
Highest NPV |
(402,192) |
|
|
|
|
|
|
|
|
|
|
Analysis Assumptions Report
Retail - Office
|
Investment Assumptions |
||
|
Price of Property |
|
$4,000,000.00 |
|
Closing Costs |
|
.5% of Property Price |
|
Date of Acquisition |
|
1 January 2008 |
|
Holding Period |
|
10 Years |
|
Inflation Rate |
|
3% per Year |
|
Sale Price Method |
|
8% Capitalization of Next Year's NOI |
|
Selling Costs |
|
7% |
|
|
|
|
|
Investor's Assumptions |
||
|
General Vacancy & Credit Loss |
|
Zero |
|
Tax Rate - First Year |
|
41.5% |
|
Tax Rate - Following Years |
|
41.5% |
|
Capital Gain Rate |
|
15% |
|
Cost Recovery Recapture Rate |
|
25% - Losses Taken Currently |
|
Present Value Discount Rate Before Debt |
|
10% per Year |
|
Present Value Discount Rate Before Tax |
|
10% per Year |
|
Present Value Discount Rate After Tax |
|
10% per Year |
|
|
|
|
|
Depreciation Assumptions |
||
|
Depreciable Amount |
|
70% of Property Price |
|
Depreciable Life |
|
39 Years |
|
Depreciation Method |
|
Straight Line |
|
Depreciation Start Date |
|
at Acquisition |
|
|
|
|
|
Loan Assumptions |
||
|
Loan Amount |
|
1.2 Times Debt Coverage |
|
Loan Interest Rate |
|
8% Annually |
|
Original Loan Period |
|
20 Years |
|
Loan Origination Date |
|
at Acquisition |
|
Loan Type |
|
Monthly Payments, Amortizing |
|
Loan Points Charged |
|
1 Point, Amortized over Loan Life |
|
|
|
|
|
Revenue Assumptions |
||
|
|
Please refer to the accompanying Lease Analysis reports |
|
|
|
|
|
|
Maintenance Expense Assumptions |
||
|
Annual Expense (20,000 SqFt @ $0.57/SqFt/Year) |
|
$11,400.00 |
|
Expense Start Date |
|
at Acquisition |
|
Expense Period |
|
Until Projected Sale |
|
Expense Growth Method |
|
Annual at the Inflation Rate |
|
|
|
|
|
Insurance Expense Assumptions |
||
|
Annual Expense (20,000 SqFt @ $0.23/SqFt/Year) |
|
$4,600.00 |
|
Expense Start Date |
|
at Acquisition |
|
Expense Period |
|
Until Projected Sale |
|
Expense Growth Method |
|
Annual at 2% Over Inflation |
|
|
|
|
|
Property Taxes Expense Assumptions |
||
|
Annual Expense |
|
1% of Property Price |
|
Expense Start Date |
|
at Acquisition |
|
Expense Period |
|
Until Projected Sale |
|
Expense Growth Method |
|
Annual at 2% Annually |
|
|
|
|
|
Security Expense Assumptions |
||
|
Annual Expense (20,000 SqFt @ $0.15/SqFt/Year) |
|
$3,000.00 |
|
Expense Start Date |
|
at Acquisition |
|
Expense Period |
|
Until Projected Sale |
|
Expense Growth Method |
|
Annual at the Inflation Rate |
|
|
|
|
|
Utilities Expense Assumptions |
||
|
Annual Expense (20,000 SqFt @ $0.17/SqFt/Year) |
|
$3,400.00 |
|
Expense Start Date |
|
at Acquisition |
|
Expense Period |
|
Until Projected Sale |
|
Expense Growth Method |
|
Annual at the Inflation Rate |
|
|
|
|
|
Management Fee Expense Assumptions |
||
|
Annual Expense |
|
$14,000.00 |
|
Expense Start Date |
|
at Acquisition |
|
Expense Period |
|
Until Projected Sale |
|
Expense Growth Method |
|
Annual at the Inflation Rate |
|
|
|
|
|
|
|
|