Time |
Investment and Sale |
Effective Income |
Operating Expense |
Cash Flow Before Debt |
Debt Service |
Cash Flow Before Tax |
| Buy | 0 | 0 | 0 | 0 | 0 | 0 |
| 2003 | (5,688,200) | 29,003 | (42,894) | (5,702,091) | 3,969,281 | (1,732,810) |
| 2004 | 0 | 656,962 | (100,266) | 556,695 | (639,664) | (82,969) |
| 2005 | 0 | 985,068 | (130,670) | 854,398 | (426,504) | 427,894 |
| 2006 | 0 | 1,011,866 | (133,975) | 877,891 | (426,504) | 451,387 |
| 2007 | 0 | 1,039,413 | (137,367) | 902,046 | (426,504) | 475,542 |
| 2008 | 0 | 1,067,730 | (140,848) | 926,882 | (426,504) | 500,378 |
| 2009 | 0 | 1,096,839 | (144,421) | 952,418 | (426,504) | 525,914 |
| 2010 | 0 | 1,126,764 | (148,088) | 978,675 | (426,504) | 552,171 |
| 2011 | 0 | 1,157,526 | (151,852) | 1,005,674 | (426,504) | 579,170 |
| 2012 | 0 | 1,189,150 | (155,715) | 1,033,435 | (426,504) | 606,931 |
| Sell | 8,831,206 | 0 | 0 | 8,831,206 | (3,738,194) | 5,093,012 |
| Total | 3,143,006 | 9,360,321 | (1,286,098) | 11,217,229 | (3,820,609) | 7,396,620 |
| Rate of Return Before Debt (IRR) | 16.6% |
| Rate of Return Before Tax (IRR) | 24.9% |
Time |
Working Capital |
Interest Income |
Members' Investment |
Cash Flow Before Tax |
Distributed To Members |
Distributed To Manager |
| Buy | 0 | 0 | 1,850,000 | 0 | 0 | 0 |
| 2003 | 267,120 | 34,269 | 115,661 | (1,732,810) | 0 | 0 |
| 2004 | 210,426 | 4,524 | 21,750 | (82,969) | 0 | 0 |
| 2005 | 437,289 | 10,758 | 0 | 427,894 | (169,431) | (42,358) |
| 2006 | 459,283 | 12,157 | 0 | 451,387 | (353,240) | (88,310) |
| 2007 | 481,896 | 12,714 | 0 | 475,542 | (372,514) | (93,129) |
| 2008 | 505,147 | 13,288 | 0 | 500,378 | (392,332) | (98,083) |
| 2009 | 529,054 | 13,878 | 0 | 525,914 | (412,708) | (103,177) |
| 2010 | 553,636 | 14,484 | 0 | 552,171 | (433,659) | (108,415) |
| 2011 | 578,912 | 15,107 | 0 | 579,170 | (455,201) | (113,800) |
| 2012 | 604,901 | 15,748 | 0 | 606,931 | (477,352) | (119,338) |
| Sell | 604,901 | 0 | 0 | 5,093,012 | (4,955,813) | (742,100) |
| Total | 0 | 146,928 | 1,987,411 | 7,396,620 | (8,022,249) | (1,508,710) |
Time |
Taxable Revenue |
Interest Income |
Taxable Expense |
Interest Expense |
Depre- ciation |
Ordinary Income |
| Buy | 0 | 0 | 0 | 0 | 0 | 0 |
| 2003 | 29,003 | 34,269 | (42,894) | 0 | (22,984) | (2,606) |
| 2004 | 656,962 | 4,524 | (100,266) | (403,991) | (110,323) | 46,906 |
| 2005 | 985,068 | 10,758 | (130,670) | (401,633) | (110,323) | 353,200 |
| 2006 | 1,011,866 | 12,157 | (133,975) | (399,029) | (110,323) | 380,696 |
| 2007 | 1,039,413 | 12,714 | (137,367) | (396,152) | (110,323) | 408,285 |
| 2008 | 1,067,730 | 13,288 | (140,848) | (392,974) | (110,323) | 436,873 |
| 2009 | 1,096,839 | 13,878 | (144,421) | (389,463) | (110,323) | 466,510 |
| 2010 | 1,126,764 | 14,484 | (148,088) | (385,584) | (110,323) | 497,253 |
| 2011 | 1,157,526 | 15,107 | (151,852) | (381,299) | (110,323) | 529,159 |
| 2012 | 1,189,150 | 15,748 | (155,715) | (376,566) | (105,726) | 566,892 |
| Sell | 0 | 0 | 0 | 0 | 0 | 0 |
| Total | 9,360,321 | 146,928 | (1,286,098) | (3,526,690) | (1,011,292) | 3,683,169 |
Time |
Distributed Cash |
Ordinary Income |
Capital Gains |
Taxable Income |
Taxes |
Cash Flow After Tax |
| Buy | (10,000) | 0 | 0 | 0 | 0 | (10,000) |
| 2003 | (625) | (11) | 0 | 57 | (22) | (648) |
| 2004 | (118) | 203 | 0 | 135 | (53) | (171) |
| 2005 | 916 | 1,527 | 0 | 1,527 | (605) | 311 |
| 2006 | 1,909 | 1,646 | 0 | 1,646 | (652) | 1,257 |
| 2007 | 2,014 | 1,766 | 0 | 1,766 | (699) | 1,314 |
| 2008 | 2,121 | 1,889 | 0 | 1,889 | (748) | 1,373 |
| 2009 | 2,231 | 2,017 | 0 | 2,017 | (799) | 1,432 |
| 2010 | 2,344 | 2,150 | 0 | 2,150 | (852) | 1,493 |
| 2011 | 2,461 | 2,288 | 0 | 2,288 | (906) | 1,554 |
| 2012 | 2,580 | 2,451 | 0 | 2,451 | (971) | 1,610 |
| Sell | 26,788 | 0 | 16,694 | 16,694 | (3,557) | 23,231 |
| Total | 32,621 | 15,927 | 16,694 | 32,621 | (9,865) | 22,756 |
| Member's Rate of Return Before Tax (IRR) | 19.5% |
| Member's Rate of Return After Tax (IRR) | 14.8% |
Time |
Manager Fees |
Distributed Cash |
Total Cash Flow |
Taxable Income |
Taxes |
Cash Flow After Tax |
| Buy | 0 | 0 | 0 | 0 | 0 | 0 |
| 2003 | 0 | 0 | 0 | (521) | 162 | 162 |
| 2004 | 0 | 0 | 0 | 9,381 | (2,908) | (2,908) |
| 2005 | 0 | 42,358 | 42,358 | 70,640 | (21,898) | 20,459 |
| 2006 | 0 | 88,310 | 88,310 | 76,139 | (23,603) | 64,707 |
| 2007 | 0 | 93,129 | 93,129 | 81,657 | (25,314) | 67,815 |
| 2008 | 0 | 98,083 | 98,083 | 87,375 | (27,086) | 70,997 |
| 2009 | 0 | 103,177 | 103,177 | 93,302 | (28,924) | 74,253 |
| 2010 | 0 | 108,415 | 108,415 | 99,451 | (30,830) | 77,585 |
| 2011 | 0 | 113,800 | 113,800 | 105,832 | (32,808) | 80,992 |
| 2012 | 0 | 119,338 | 119,338 | 113,378 | (35,147) | 84,191 |
| Sell | 0 | 742,100 | 742,100 | 772,076 | (154,415) | 587,685 |
| Total | 0 | 1,508,710 | 1,508,710 | 1,508,710 | (382,772) | 1,125,938 |
| Managing Member's Present Value Before Tax @10% | 727,793 |
| Managing Member's Present Value After Tax @10% | 540,054 |
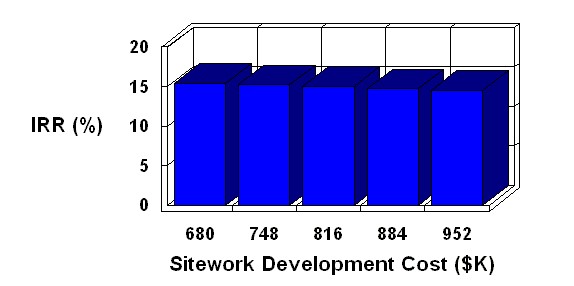
Sitework Development Cost
versus
Member's Rate of Return After Tax
| Assumption | IRR |
| $680,000.00 | 15.4% |
| $748,000.00 | 15.2% |
| $816,000.00 | 15.0% |
| $884,000.00 | 14.7% |
| $952,000.00 | 14.5% |
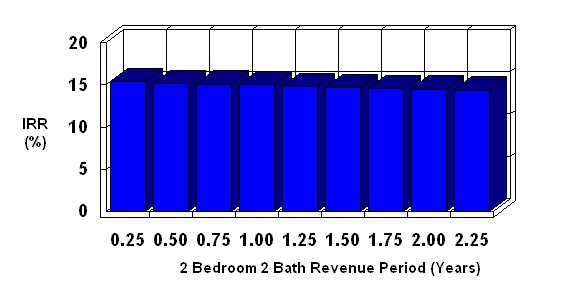
2 Bedroom 2 Bath Revenue Period
versus
Member's Rate of Return After Tax
| Assumption | IRR |
| .25 Years | 15.4% |
| .5 Years | 15.2% |
| .75 Years | 15.1% |
| 1 Year | 15.0% |
| 1.25 Years | 14.8% |
| 1.5 Years | 14.7% |
| 1.75 Years | 14.6% |
| 2 Years | 14.5% |
| 2.25 Years | 14.4% |
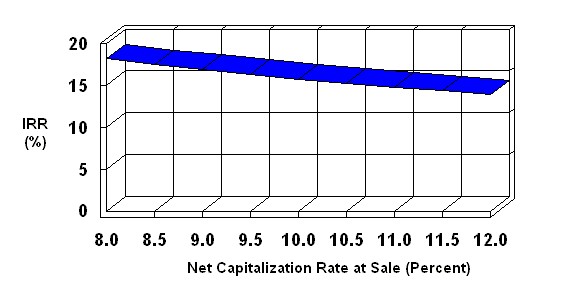
Net Capitalization Rate at Sale
versus
Member's Rate of Return After Tax
| Assumption | IRR |
| 8% Net Cap Rate | 18.2% |
| 8.5% Net Cap Rate | 17.5% |
| 9% Net Cap Rate | 17.0% |
| 9.5% Net Cap Rate | 16.4% |
| 10% Net Cap Rate | 15.8% |
| 10.5% Net Cap Rate | 15.3% |
| 11% Net Cap Rate | 14.8% |
| 11.5% Net Cap Rate | 14.4% |
| 12% Net Cap Rate | 13.9% |
| Risk Analysis Assumption | Lowest | Likely | Highest |
| Structure Development Cost | $200,000.00 | $266,000.00 | $300,000.00 |
| Building Skin Development Cost | $400,000.00 | $461,600.00 | $600,000.00 |
| Roof Systems Development Cost | $170,000.00 | $206,400.00 | $250,000.00 |
| One Bedroom Revenue Period | .5 Years | 1 Year | 2 Years |
| 2 Bedroom 1 Bath Revenue Period | .25 Years | 1.25 Years | 2.25 Years |
| 2 Bedroom 2 Bath Revenue Period | .25 Years | 1.25 Years | 2.25 Years |
| Net Capitalization Rate at Sale | 8% Net Cap Rate | 10% Net Cap Rate | 12% Net Cap Rate |
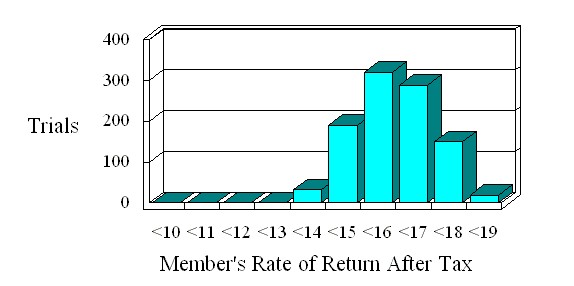
| Average IRR | 15.9% | Lowest IRR | 13.2% | Standard Deviation | 1.1% | Highest IRR | 18.7% |
| Investment Assumptions | ||
| Price of Property | None | |
| Date of Acquisition | 1 January 2003 | |
| Holding Period | 10 Years | |
| Inflation Rate | 3% per Year | |
| Sale Price Method | 11% Capitalization of Last Year's NOI | |
| Selling Costs | 6% | |
| Group Member's Assumptions | ||
| General Vacancy & Credit Loss | Zero | |
| Tax Rate - First Year | 39.6% | |
| Tax Rate - Following Years | 39.6% | |
| Capital Gain Rate | 20% | |
| Cost Recovery Recapture Rate | 25% - Losses Carried Forward | |
| Present Value Discount Rate Before Debt | 10% per Year | |
| Present Value Discount Rate Before Tax | 10% per Year | |
| Present Value Discount Rate After Tax | 10% per Year | |
| Group Assumptions | ||
| Total Initial Investment | $1,850,000.00 | |
| Working Capital Minimum | $35,000.00 | |
| Working Capital Maximum | $35,000.00 | |
| Working Capital Interest Rate | 5% per Year | |
| Managing Member Loan Interest Rate | Members are Assessed | |
| Managing Member Tax Rate | 31% per Year | |
| Number of Units Issued | 185 | |
| Cash Distribution Pattern | Yearly in January | |
| Distribution Assumptions | ||
| Cash Distribution Start Date | 1 January 2004 | |
| Preferred Return to Members | None | |
| Cash to Members | 80% | |
| Net Taxable Income to Members | 80% | |
| Investment Return to Members | 100% of Investment | |
| Sale Proceeds to Members | 80% | |
| Capital Gain to Members | 80% | |
| Land Development Spending Assumptions | ||
| Development Cost | $2,850,000.00 | |
| Depreciable Life | Non-Depreciable Asset | |
| Depreciation Method | Straight Line | |
| Include in Draws | 50% | |
| Expenditure Start | 1 March 2003 | |
| Depreciation Start Date | 1 October 2003 | |
| Expenditure Months | 1 Month | |
| Sitework Development Spending Assumptions | ||
| Development Cost | $855,000.00 | |
| Depreciable Life | 27.5 Years | |
| Depreciation Method | Straight Line | |
| Include in Draws | 100% | |
| Expenditure Start | 1 March 2003 | |
| Depreciation Start Date | 1 October 2003 | |
| Expenditure Months | 1 Month | |
| Foundations & Floor Slab Development Spending Assumptions | ||
| Development Cost | $389,200.00 | |
| Depreciable Life | 27.5 Years | |
| Depreciation Method | Straight Line | |
| Include in Draws | 100% | |
| Expenditure Start | 1 March 2003 | |
| Depreciation Start Date | 1 October 2003 | |
| Expenditure Months | 1 Month | |
| Structure Development Spending Assumptions | ||
| Development Cost | $266,000.00 | |
| Depreciable Life | 27.5 Years | |
| Depreciation Method | Straight Line | |
| Include in Draws | 100% | |
| Expenditure Start | 1 April 2003 | |
| Depreciation Start Date | 1 October 2003 | |
| Expenditure Months | 1 Month | |
| Building Skin Development Spending Assumptions | ||
| Development Cost | $461,600.00 | |
| Depreciable Life | 27.5 Years | |
| Depreciation Method | Straight Line | |
| Include in Draws | 100% | |
| Expenditure Start | 1 May 2003 | |
| Depreciation Start Date | 1 October 2003 | |
| Expenditure Months | 1 Month | |
| Doors, Balconies Development Spending Assumptions | ||
| Development Cost | $258,800.00 | |
| Depreciable Life | 27.5 Years | |
| Depreciation Method | Straight Line | |
| Include in Draws | 100% | |
| Expenditure Start | 1 May 2003 | |
| Depreciation Start Date | 1 October 2003 | |
| Expenditure Months | 1 Month | |
| Roof Systems Development Spending Assumptions | ||
| Development Cost | $206,400.00 | |
| Depreciable Life | 27.5 Years | |
| Depreciation Method | Straight Line | |
| Include in Draws | 100% | |
| Expenditure Start | 1 June 2003 | |
| Depreciation Start Date | 1 October 2003 | |
| Expenditure Months | 1 Month | |
| Electrical Development Spending Assumptions | ||
| Development Cost | $33,600.00 | |
| Depreciable Life | 27.5 Years | |
| Depreciation Method | Straight Line | |
| Include in Draws | 100% | |
| Expenditure Start | 1 July 2003 | |
| Depreciation Start Date | 1 October 2003 | |
| Expenditure Months | 1 Month | |
| Exterior Contingency Development Spending Assumptions | ||
| Development Cost | $79,200.00 | |
| Depreciable Life | 27.5 Years | |
| Depreciation Method | Straight Line | |
| Include in Draws | 100% | |
| Expenditure Start | 1 May 2003 | |
| Depreciation Start Date | 1 October 2003 | |
| Expenditure Months | 1 Month | |
| Pool Development Spending Assumptions | ||
| Development Cost | $150,000.00 | |
| Depreciable Life | 27.5 Years | |
| Depreciation Method | Straight Line | |
| Include in Draws | 100% | |
| Expenditure Start | 1 May 2003 | |
| Depreciation Start Date | 1 October 2003 | |
| Expenditure Months | 1 Month | |
| Landscaping Development Spending Assumptions | ||
| Development Cost | $110,400.00 | |
| Depreciable Life | 27.5 Years | |
| Depreciation Method | Straight Line | |
| Include in Draws | 100% | |
| Expenditure Start | 1 August 2003 | |
| Depreciation Start Date | 1 October 2003 | |
| Expenditure Months | 1 Month | |
| Permits Development Spending Assumptions | ||
| Development Cost | $10,000.00 | |
| Depreciable Life | 27.5 Years | |
| Depreciation Method | Straight Line | |
| Include in Draws | 100% | |
| Expenditure Start | 1 February 2003 | |
| Depreciation Start Date | 1 October 2003 | |
| Expenditure Months | 1 Month | |
| Legal & Title Development Spending Assumptions | ||
| Development Cost | $18,000.00 | |
| Depreciable Life | 27.5 Years | |
| Depreciation Method | Straight Line | |
| Include in Draws | 100% | |
| Expenditure Start | 1 February 2003 | |
| Depreciation Start Date | 1 October 2003 | |
| Expenditure Months | 1 Month | |
| Construction Draw Assumptions | ||
| Draw Percent | 100% | |
| Draw Rate | 9% Annually | |
| Draw Period | 1 Month | |
| Draw Treatment | Paid and Capitalized | |
| Draw Limit | None | |
| Draw Points | None | |
| Permanent Loan Assumptions | ||
| Loan Amount | 95% of Draw Loan Balance | |
| Loan Interest Rate | 10% Annually | |
| Original Loan Period | 30 Years | |
| Loan Origination Date | 1 January 2004 | |
| Loan Type | Monthly Payments, Amortizing | |
| Studio Revenue Assumptions | ||
| Annual Revenue | $900.00 | |
| Revenue Start Date | 1 October 2003 | |
| Revenue Period | 1 Year | |
| Revenue Growth Method | Ramp to $108,000.00 | |
| Vacancy Factor | 5% | |
| Studio Continued Revenue Assumptions | ||
| Annual Revenue | Continuation | |
| Revenue Start Date | Continuation | |
| Revenue Period | Until Projected Sale | |
| Revenue Growth Method | Annual at the Inflation Rate | |
| Vacancy Factor | 10% | |
| One Bedroom Revenue Assumptions | ||
| Annual Revenue | $1,250.00 | |
| Revenue Start Date | 1 October 2003 | |
| Revenue Period | 1 Year | |
| Revenue Growth Method | Ramp to $225,000.00 | |
| Vacancy Factor | 5% | |
| One Bedroom Continued Revenue Assumptions | ||
| Annual Revenue | Continuation | |
| Revenue Start Date | Continuation | |
| Revenue Period | Until Projected Sale | |
| Revenue Growth Method | Annual at the Inflation Rate | |
| Vacancy Factor | 10% | |
| 2 Bedroom 1 Bath Revenue Assumptions | ||
| Annual Revenue | $1,500.00 | |
| Revenue Start Date | 1 October 2003 | |
| Revenue Period | 1.25 Years | |
| Revenue Growth Method | Ramp to $450,000.00 | |
| Vacancy Factor | 5% | |
| 2 Bedroom 1 Bath Continued Revenue Assumptions | ||
| Annual Revenue | Continuation | |
| Revenue Start Date | Continuation | |
| Revenue Period | Until Projected Sale | |
| Revenue Growth Method | Annual at the Inflation Rate | |
| Vacancy Factor | 10% | |
| 2 Bedroom 2 Bath Revenue Assumptions | ||
| Annual Revenue | $1,700.00 | |
| Revenue Start Date | 1 October 2003 | |
| Revenue Period | 1.25 Years | |
| Revenue Growth Method | Ramp to $306,000.00 | |
| Vacancy Factor | 5% | |
| 2 Bedroom 2 Bath Continued Revenue Assumptions | ||
| Annual Revenue | Continuation | |
| Revenue Start Date | Continuation | |
| Revenue Period | Until Projected Sale | |
| Revenue Growth Method | Annual at 1% Under Inflation | |
| Vacancy Factor | 10% | |
| Laundry Revenue Assumptions | ||
| Annual Revenue | $150.00 | |
| Revenue Start Date | 1 October 2003 | |
| Revenue Period | 1 Year | |
| Revenue Growth Method | Ramp to $3,000.00 | |
| Vacancy Factor | 75% | |
| Laundry Continued Revenue Assumptions | ||
| Annual Revenue | Continuation | |
| Revenue Start Date | Continuation | |
| Revenue Period | Until Projected Sale | |
| Revenue Growth Method | Annual at the Inflation Rate | |
| Vacancy Factor | 10% | |
| Management Expense as % of EI Assumptions | ||
| Expense Percentage | 5% of Effective Income | |
| Expense Start Date | at Acquisition | |
| Expense Period | Until Projected Sale | |
| Utilities Expense as % of EI Assumptions | ||
| Expense Percentage | 3% of Effective Income | |
| Expense Start Date | at Acquisition | |
| Expense Period | Until Projected Sale | |
| Property Tax Expense Assumptions | ||
| Annual Expense | $35,284.00 | |
| Expense Start Date | at Acquisition | |
| Expense Period | Until Projected Sale | |
| Expense Growth Method | Annual at 2% Annually | |
| Gardner Expense Assumptions | ||
| Annual Expense | $1,000.00 | |
| Expense Start Date | at Acquisition | |
| Expense Period | Until Projected Sale | |
| Expense Growth Method | Annual at the Inflation Rate | |
| Insurance Expense Assumptions | ||
| Annual Expense | $3,000.00 | |
| Expense Start Date | at Acquisition | |
| Expense Period | Until Projected Sale | |
| Expense Growth Method | Annual at the Inflation Rate | |
| Pool Expense Assumptions | ||
| Annual Expense | $1,000.00 | |
| Expense Start Date | at Acquisition | |
| Expense Period | Until Projected Sale | |
| Expense Growth Method | Annual at the Inflation Rate | |
| Reserve Expense as % of EI Assumptions | ||
| Expense Percentage | 1% of Effective Income | |
| Expense Start Date | at Acquisition | |
| Expense Period | Until Projected Sale | |