Back to Unit Sales Index - planEASe Home Page
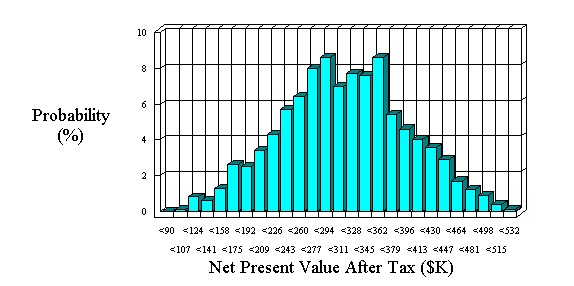
Risk Analysis allows you to combine variations in many assumptions. Here we vary both the Sales and Costs Multipliers at the same time in the same ranges as in Sensitivity Analysis, and show the resulting Probability Distribution of the NPV of the project (at 10% After Tax). Very reassuringly, given these ranges, there is no measurable probability of losing money on the project.
| Risk Analysis Assumption | Lowest | Likely | Highest |
| Unit Sales Price Multiplier | 90% | 100% | 110% |
| Unit Sales Cost Multiplier | 90% | 100% | 110% |
| Average NPV | 308,202 | Lowest NPV | 97,296 | Standard Deviation | 80,245 | Highest NPV | 517,968 |
The data and calculations presented herein, while not guaranteed,
have been obtained from sources we believe to be reliable.
Produced by planEASe from Analytic Associates (800) 959-3273
Risk Analysis results may also be presented as a Cumulative Probability Distribution, which may allow easier interpretation of the results in some cases.
| Risk Analysis Assumption | Lowest | Likely | Highest |
| Unit Sales Price Multiplier | 90% | 100% | 110% |
| Unit Sales Cost Multiplier | 90% | 100% | 110% |
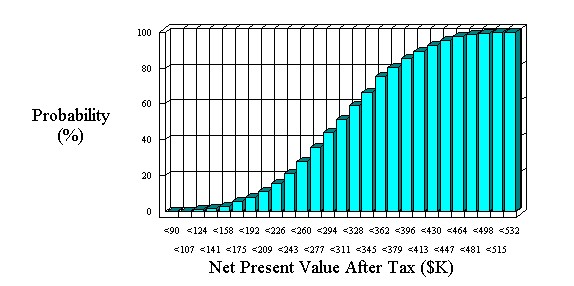
| Average NPV | 308,202 | Lowest NPV | 97,296 | Standard Deviation | 80,245 | Highest NPV | 517,968 |
The data and calculations presented herein, while not guaranteed,
have been obtained from sources we believe to be reliable.
Produced by planEASe from Analytic Associates (800) 959-3273